Layouts are one of the special features of Azimutt 🪄
Instead of showing all the entities in a single diagram like in other ERD tools,
Azimutt let you create and organize any number of layouts where you choose exactly which entities and attributes are shown.
And that changes everything...
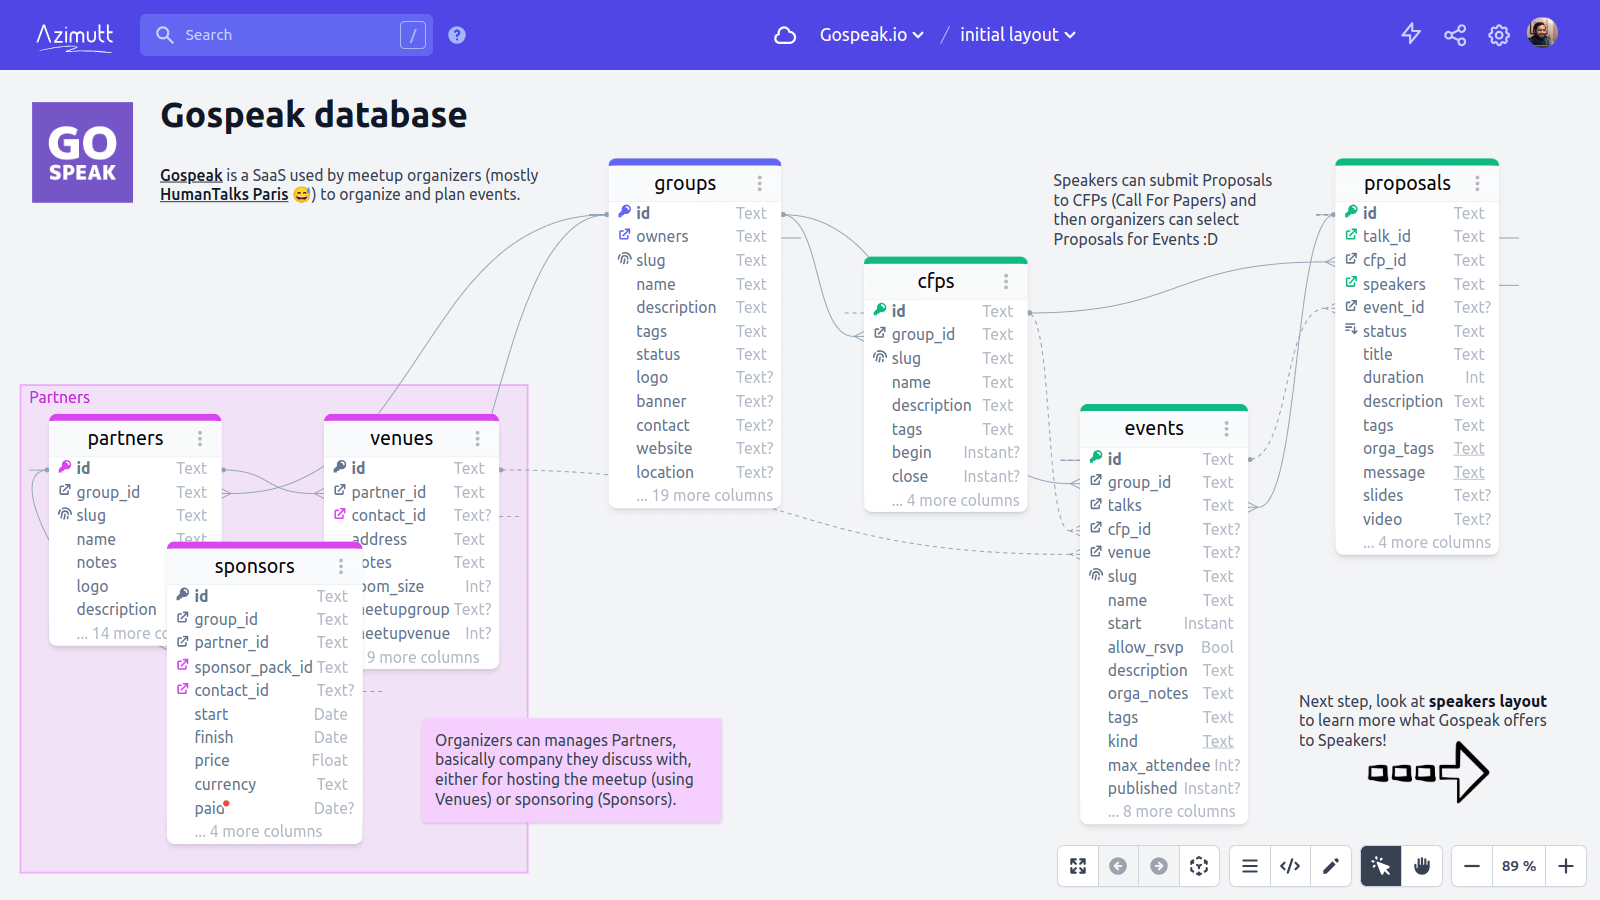
Azimutt is made for real world databases: large and messy ones.
Where the other Entity-Relationship Diagram tools often fall short due to information overloading, or even crash completely.
With such databases, there is no way to show every entity at once.
That's why new layouts are created empty, and YOU select what you need using search or following relations.
With such databases, even a single entity can be overwhelming with hundreds of attributes 🤯
That's why entities only show the 15 most important attributes: primary key, relations, indexes and then SQL order.
Layouts are the central piece of Azimutt showing relevant information:
Structuration #
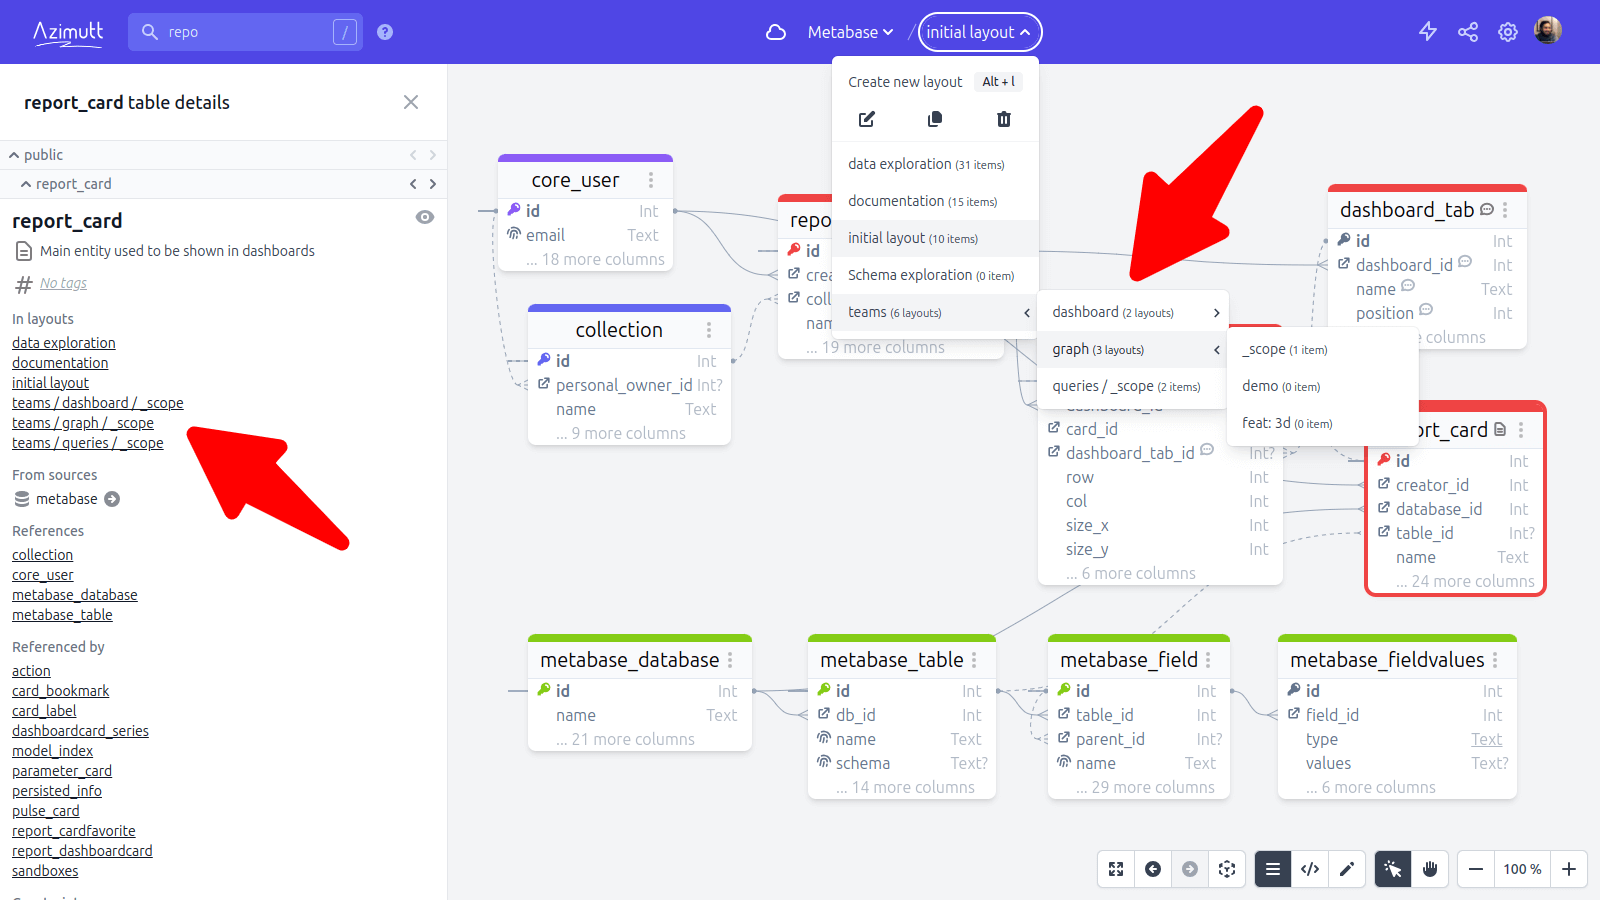
Layouts are sorted alphabetically and can be organized in a folder structure. This is especially important when working with other people to share knowledge.
To use layout folders, just name your layout with its full path using / (ex: teams / revenue / mrr).
Folders with a single layout are collapsed, so it's normal that you don't see them for your first one 😅
Layouts are a great way to document your database, explaining use cases or issues for example. They are also very useful to visualize a team scope, especially because you can see on entity details all the layouts where it's included. That's a way to see teams working on similar topics.
Entities #
Like all Entity-Relationship Diagram tools, Azimutt main goal is to show database entities and how they reference each other to help you better understand your database with visual help. Unlike most of the Entity-Relationship Diagram tools, Azimutt has been engineered to handle production databases, often large, complex and even messy (if you are honest). And that led to many original choices, big and small, you don't really see at first look but are game changer when using Azimutt for real. We already talked about the multi-layout approach built from scratch using search and relation navigation instead of a single overcrowded diagram. But there is also many specificities for entities:
-
Hidden attributes: you can see them on all screenshot, Azimutt hide some attributes by default.
You may think it's a detail, but this is absolutely necessary to keep the exploration smooth, you don't want your screen filled with a huge entity or hide attributes every time you show an entity.
For that, Azimutt sort attributes by relevance (see below), remove the useless ones (see settings) and then keeps only the first 15 attributes.
You can configure this in project settings and even a bit more:
 That's for the default behavior to give you a pleasant exploration, but of course, on all layouts for each entity you can choose to hide or show each attribute individually.
-
Sorted attributes: for a nice exploration and with the hidden attributes by default, it's important to keep the most relevant attributes at the beginning,
which is often not the case in the database as new attributes are often added at the end of an entity.
Azimutt has different sorting configuration you can define globally in project settings or for layout entities directly.
The default one (by property) order by: primary key, relations, indexes and then sql order.
- Hidden relations: this one is also really important to keep a clean diagram and avoid the big mess you may see in other tools. Azimutt doesn't display relations from/to hidden entities and attributes. This is especially useful for attributes like `created_by` and `updated_by` would have created a lot of useless relations in the diagram. So, if you want to hide a relation, just hide its source attribute.
-
Collapsed entities: for some entities, you may want to see relations but not attributes. This is often the case for entities used to materialize an n-m relation.
In this case, you can collapse the entity from its context menu (right-click on the header).
Attributes will be collapsed and relations will be linked to the entity header (see "report_dashboardcard" entity).
Even with collapsed entities, Azimutt keep the distinction between shown and hidden attributes to display or not relations.

-
Simplified types: attribute types are really important for database queries and performance.
But when exploring the database, they may be more noise than signal.
Azimutt "simplify" attribute types for a lighter interface, but you can change this in project settings: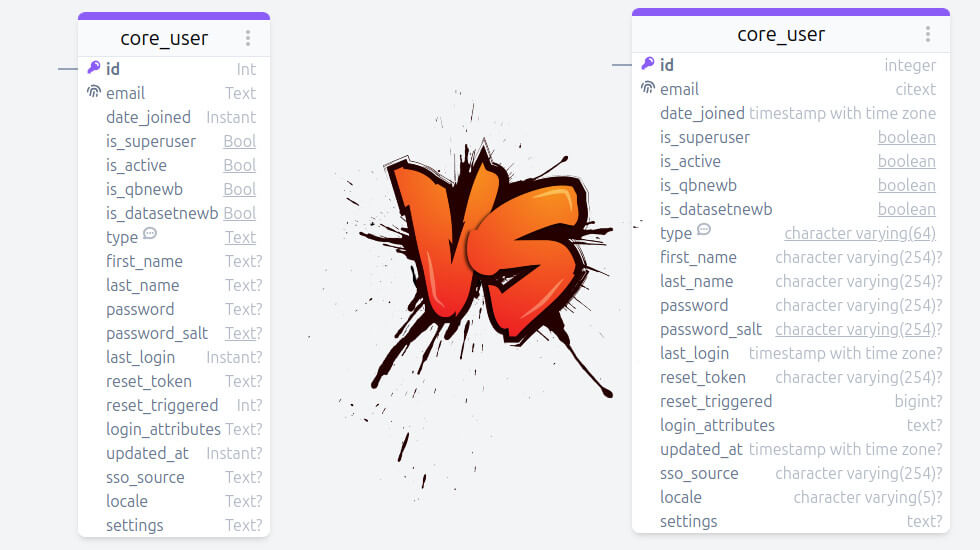
-
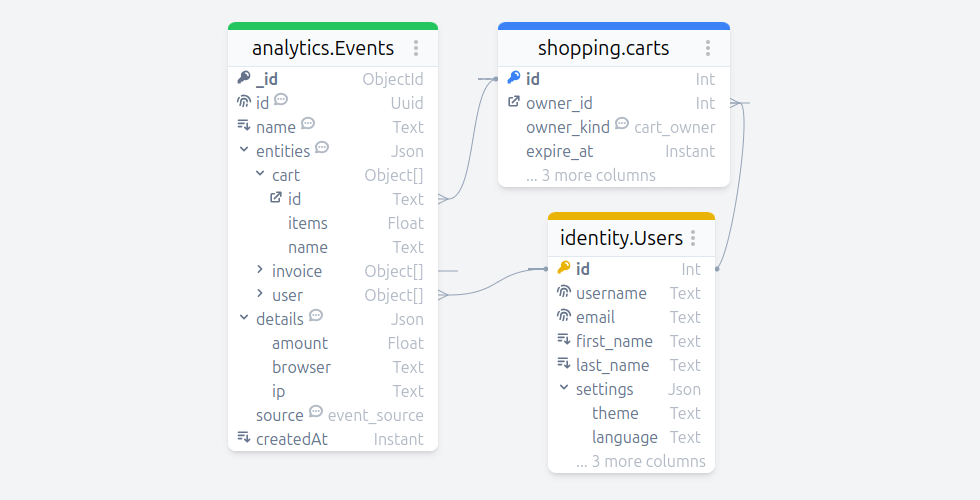
Nested attributes: to make real world databases easily explorable and understandable, Azimutt is doing the extra mile to help its users.
Many ERD tools and even SQL clients just show entities and their attributes. But reality is more complex, especially with JSON attributes.
Azimutt fetch a sample to infer a schema and show nested columns right into the diagram.
And it's even better, it infers and creates relations from/to nested attributes, making exploration and understanding way easier 🚀
Groups #
Groups are a way to show in a layout that tables belong to a same context or concept. They are shown as a colored background behind the entities and have a name. Making the entities belonging very obvious.
To create a group, select one or several entities, right-click an entity header to open its context menu and look for "Create group", directly in the list or under "Groups" is a group already exists in the layout. You can also add and remove entities from already existing groups, change their name and color.
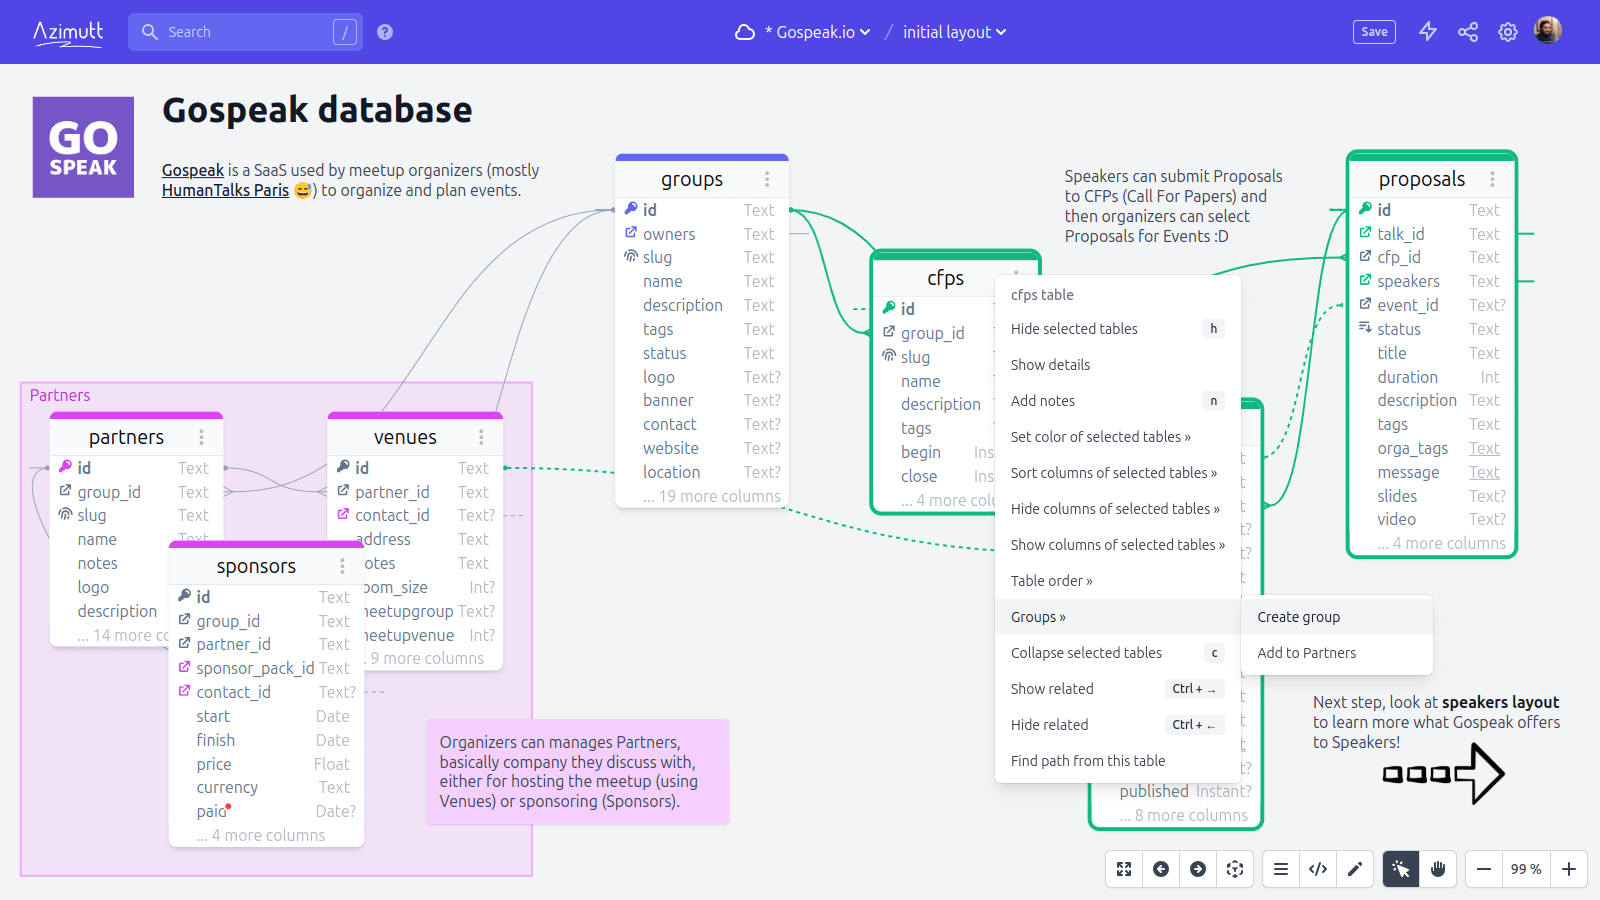
Of course, an entity can be in different groups but don't push it, it will be very ugly fast ^^
For now groups just have a name, a color and a set of entities. We have planned to add a markdown description but also allow to collapse them to have a more dynamic layout structure. Let us know if you need these features so we can prioritize them.
Memos #
They are standalone Markdown elements you can place in a layout. They are very visual and can add all needed context, especially if you use Markdown at its full power 💪
To add them, just double-click on the layout background or toggle layout context menu with a right-click on the background and select "New memo". To edit, double-click on them, they will change to edit mode, once you are done, just exit the edit area. If you empty the text, the memo will be removed. To change the background color, open the memo contextual menu with a right-click.
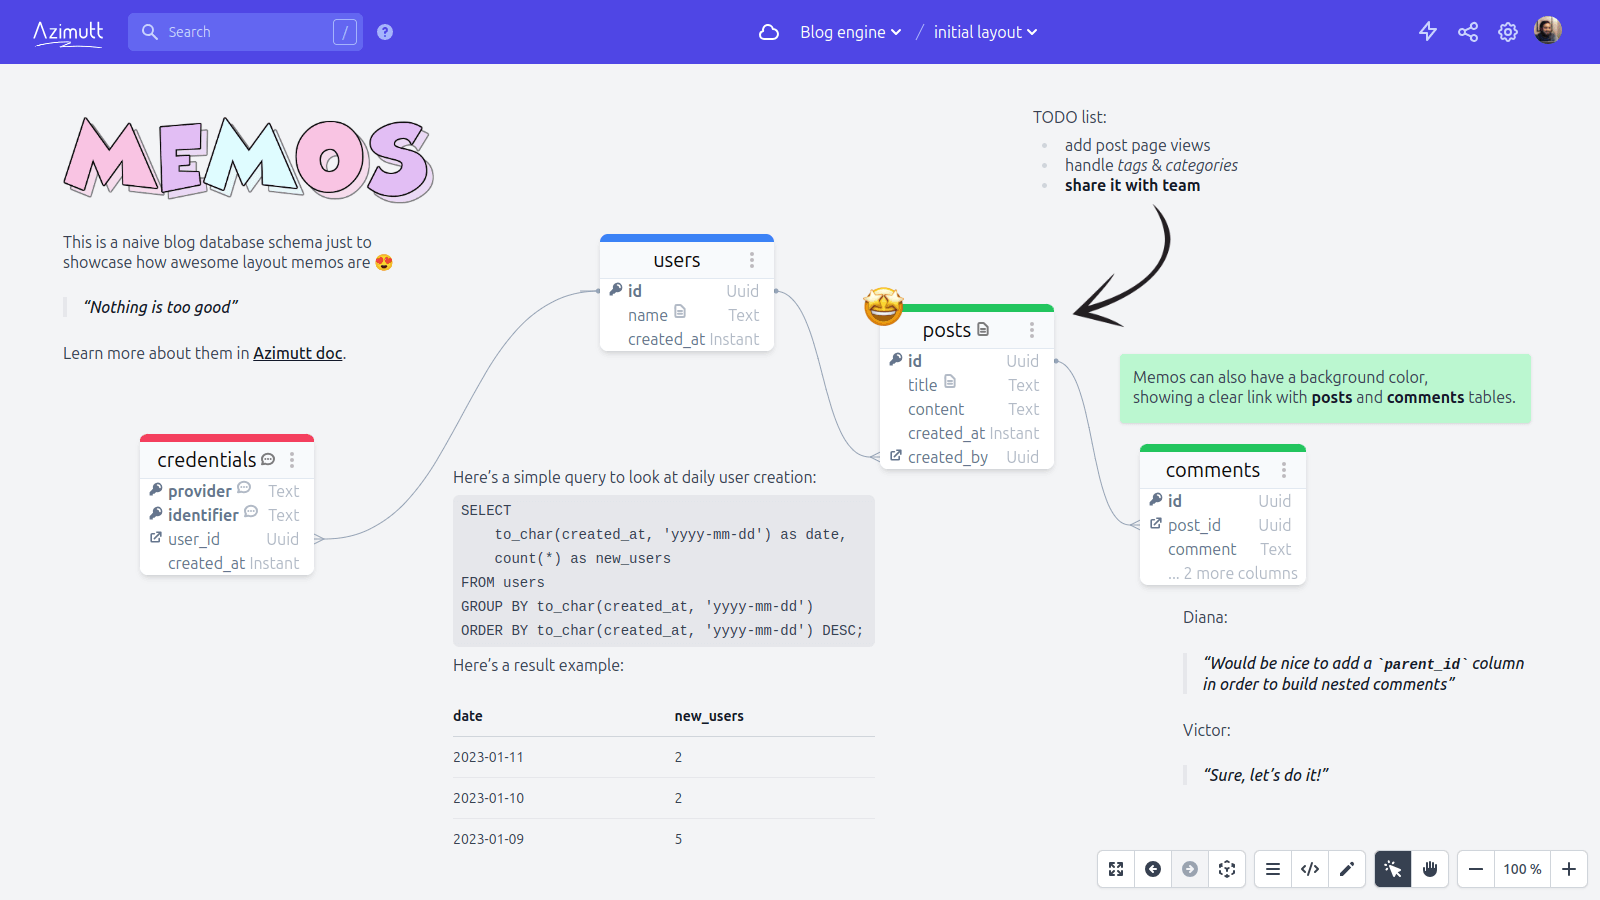
As you can see they are very helpful and can serve many use cases: explain the layout context/purpose, detail how entities interact or should be used, show queries, and even hold discussions or TODO lists ^^
We are planning to add more canvas interactions like discussion feed with reactions, stickers (arrows, emoji) and even a drawing pen. But in the meantime, you can already do great documentation.
Rows #
Azimutt is not just an Entity-Relationship Diagram tool importing your database schema just once.
It's a complete toolset to work with your day-to-day databases and give you everything necessary in a single app (still some improvements needed, but close ^^).
In addition to the schema, you can explore data if you used a database connection for one or several sources.
Of course, you can run queries and dig into the results. But Azimutt also keeps a mapping between your query results and the schema, allowing to add rows in the layout and follow relations inside the data, even in a cross-database context 🤩
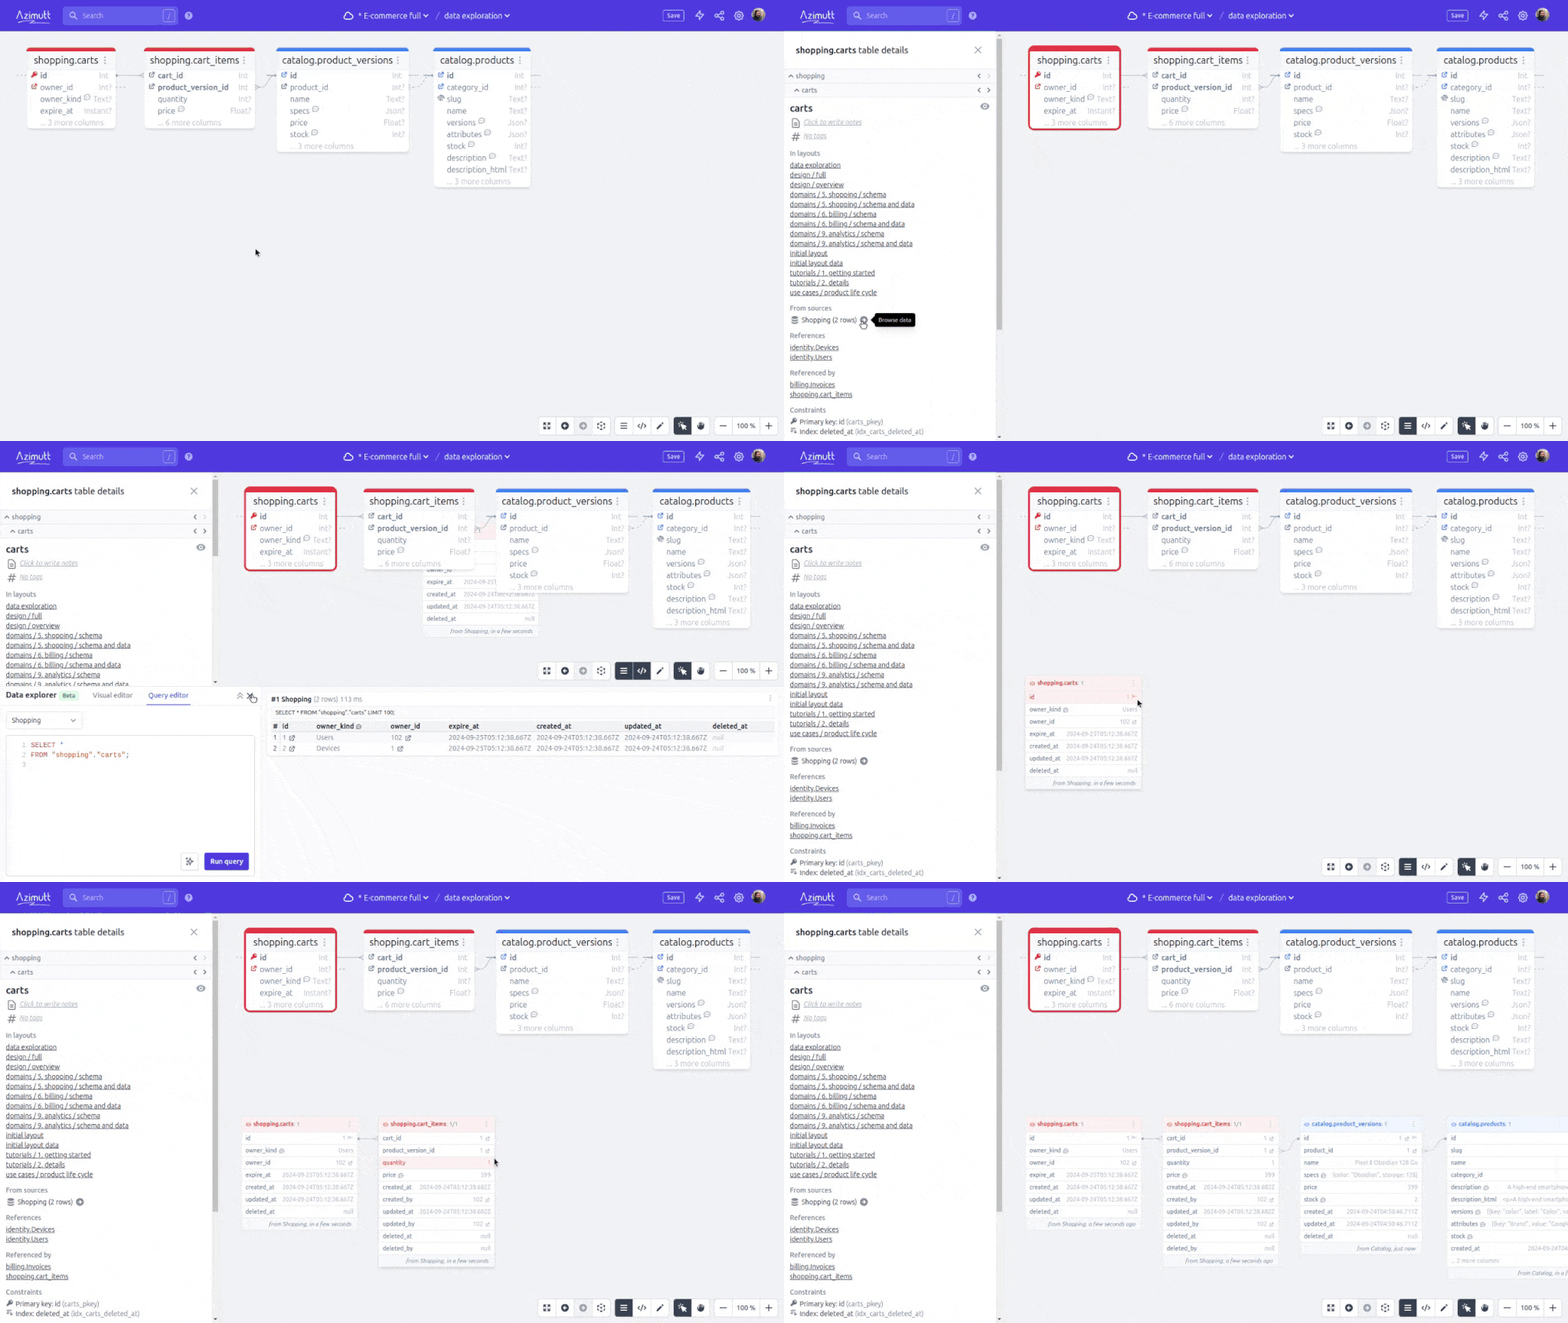
This still needs some improvements to better format some values like dates and JSON, and improve UX with hidden columns by default and more, but it's already quite useful. Let us know what you think and which improvement you would like.
Queries #
Not implemented yet!
Adding individual rows to the layout and following relations already feels like magic. But we could push further and add the whole query with its results to the layout. And add display options like: query and table (of course), but also line chart, bar chart, pie chart and more. Some Azimutt layout could be used as dashboards or at least data showcase.
This is on our mind for quite some time, we are just waiting for the perfect customer use case to build the feature together. If that's you, tell us, and we could partner on this 😎
Tips #
Azimutt has a lot of shortcuts and quality of life features.
One that is very helpful to work on layouts is the group action:
select several tables (ctrl + a for all, ctrl + click to add/remove one to the selection or draw a select box with click and drag on the layout background)
and your performed actions will be applied to the selected tables (move but also change color, collapse, sort attributes and others).