An ERD that scales
If you already tried an ERD, you know. They look cool on screenshots but terrible with real world databases. We made Azimutt to fix this, learn how 👇️
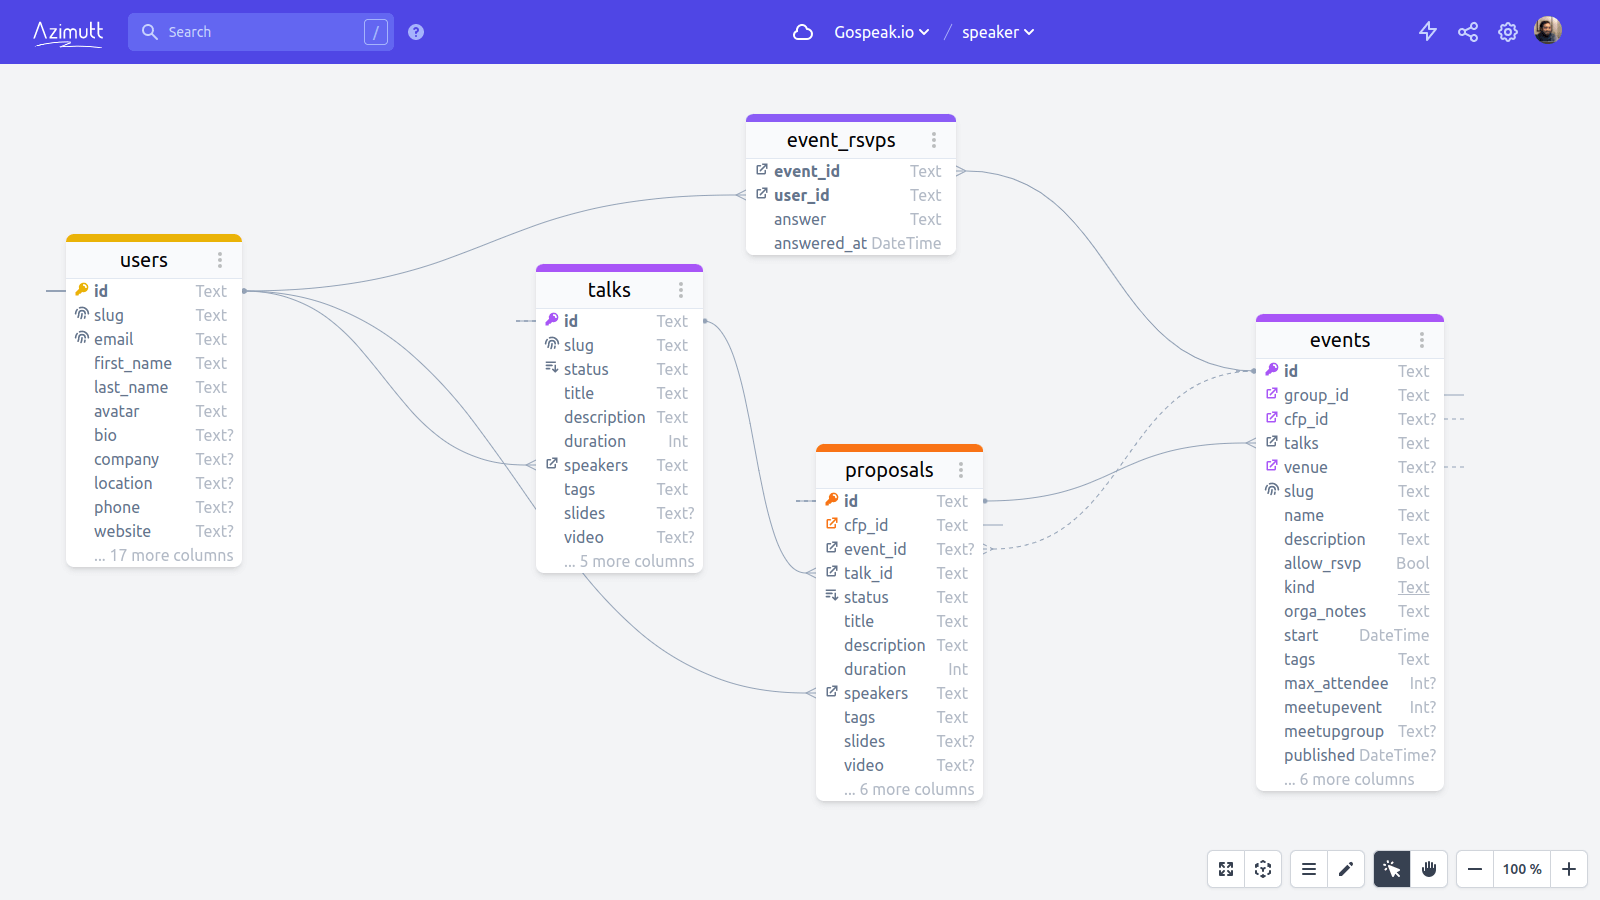
Almost all database visualization tools show all tables and columns in the database. Which is fine for small databases but make them hardly usable with real world databases, like a 🧶.
Azimutt let you display what you want, making it great for complex databases, from 20 to 500 or even 2000 tables.
- Search everywhere: most of the time, you don't really know where to start. Azimutt let you search in table and column names, SQL comments, relations, notes to find the relevant ones.
- See what you need: once you found your starting point, navigate from it and decide which tables and columns to show on your diagram. So it will be perfectly clear, for you, and for others.
- Save as many diagrams as you want: instead of having one giant diagram for your database, build one for each use case. They will be much clearer and still evolve with your schema updates.