DrawSQL vs Azimutt, which database tool is right for you?
Are you looking for a DrawSQL alternative? Or simply searching about Entity-Relationship Diagramming tools (ERD)? If you are designing your database schema or trying to explore your current database, you are at the right place.
When working with complex databases, choosing the right tool can make a significant difference. Two leading options for visualizing and understanding databases are DrawSQL and Azimutt. While both serve as effective database visualization tools, they cater to different needs and priorities. In this article, we’ll compare the two platforms based on features, use cases, pricing, and overall suitability to help you decide which is the best fit for your requirements.
Entity-Relationship Diagrams (ERDs) visually represent entities and their relationships (yes, obvious!). In the context of relational databases, entities correspond to tables with their columns, while relationships are represented by foreign keys. Some ERDs are tailored specifically for database, offering advanced features like primary keys, indexes, constraints, and other database-specific details.
DrawSQL and Azimutt are both ERDs specialized at visualizing databases structure, but Azimutt has a wider scope. We will dive into details but here is a quick feature comparison overview:
| DrawSQL | Azimutt | |
|---|---|---|
| Define database schema | ✅ Yes (UI forms) | ✅ Yes (special language: AML) |
| Documentation | ✅ Yes (only comments) | ✅ Yes (comments and tags, multi-layout, sticky notes) |
| Database import | ✅ Yes (SQL) | ✅ Yes (db connection, SQL, Prisma, JSON...) |
| Database sync | ❌ No | ✅ Yes |
| Export diagram | ✅ Yes (SQL, JSON, Image) | ✅ Yes (SQL, JSON, AML) |
| Collaboration | ✅ Yes | ✅ Yes |
| Version history | ✅ Yes | ❌ No |
| Scaling | ⚠️ Harder to use with >50 tables | ✅ Handles >1000 tables without issue |
| Multi-layouts | ❌ No, all tables are displayed | ✅ Yes, choose tables/columns for each layout |
| Multi-sources | ❌ No | ✅ Yes, visualize several databases at once |
| Database queries | ❌ No | ✅ Yes |
| Visual data exploration | ❌ No | ✅ Yes |
| Database linter | ❌ No | ✅ Yes |
| On-Premise | ❌ No | ✅ Yes |
| Open-Source | ❌ No | ✅ Yes |
| Free use | ✅ Yes (account needed) | ✅ Yes (no account needed) |
| Basic plan | $19/month | 9€/month |
About DrawSQL #
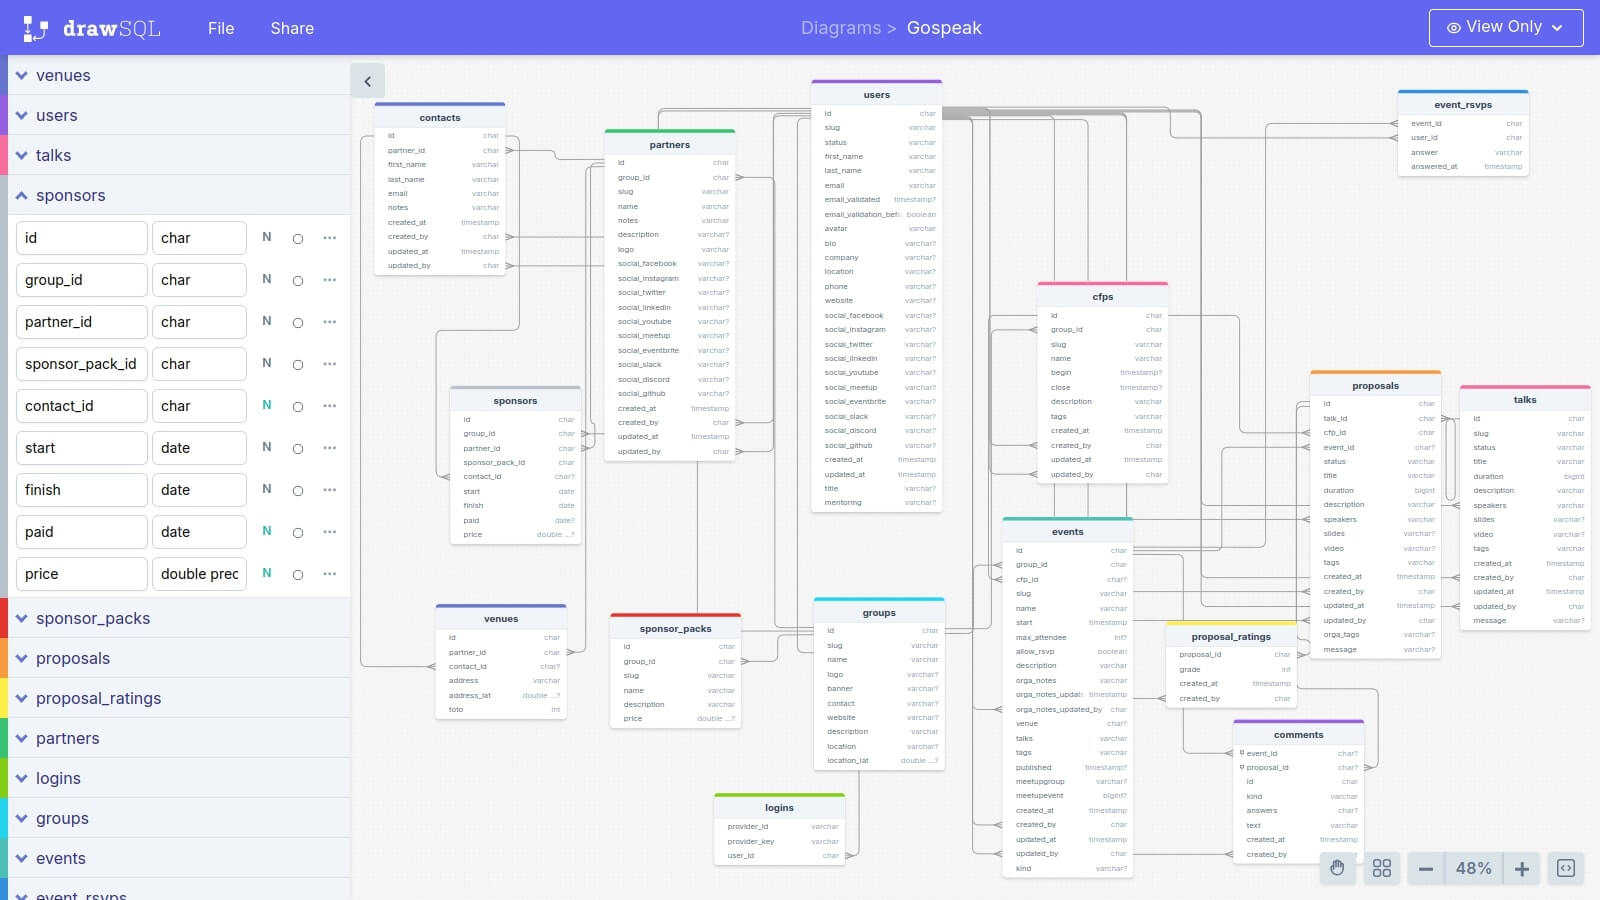
DrawSQL is a cloud-based tool focused on creating beautiful Entity-Relationship Diagrams (ERDs). It offers a simple and intuitive interface to design and share database schemas, making it popular among small teams and projects requiring quick visual representations.
About Azimutt #
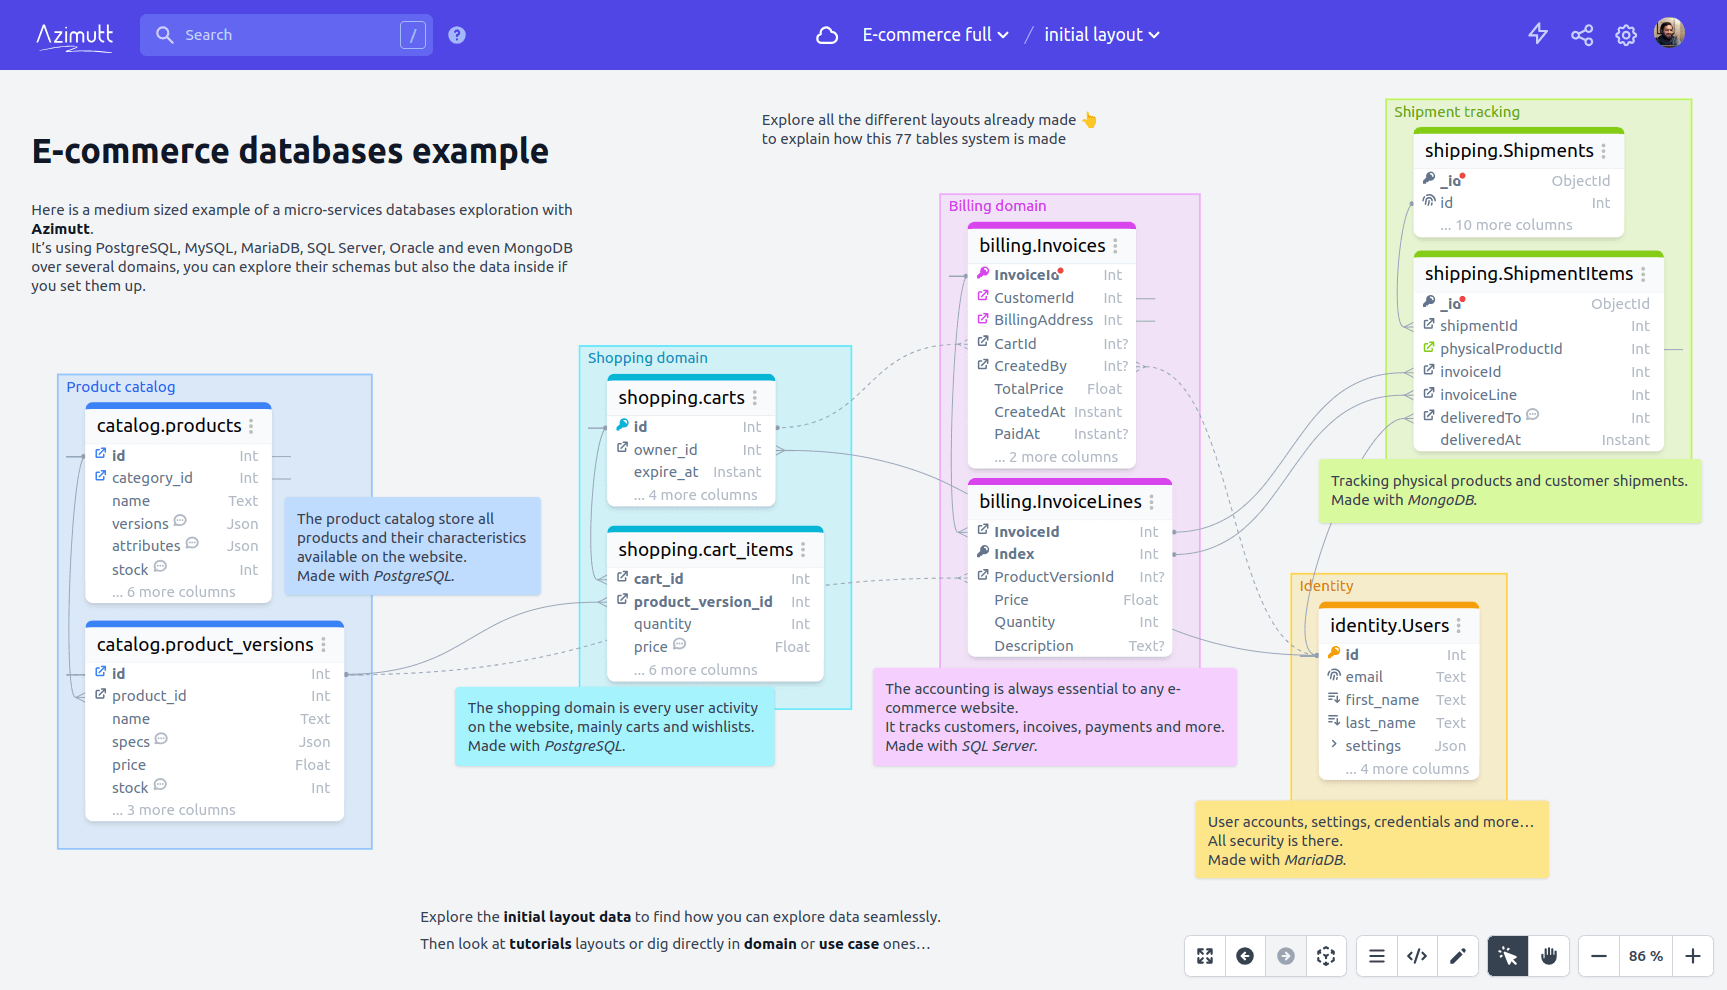
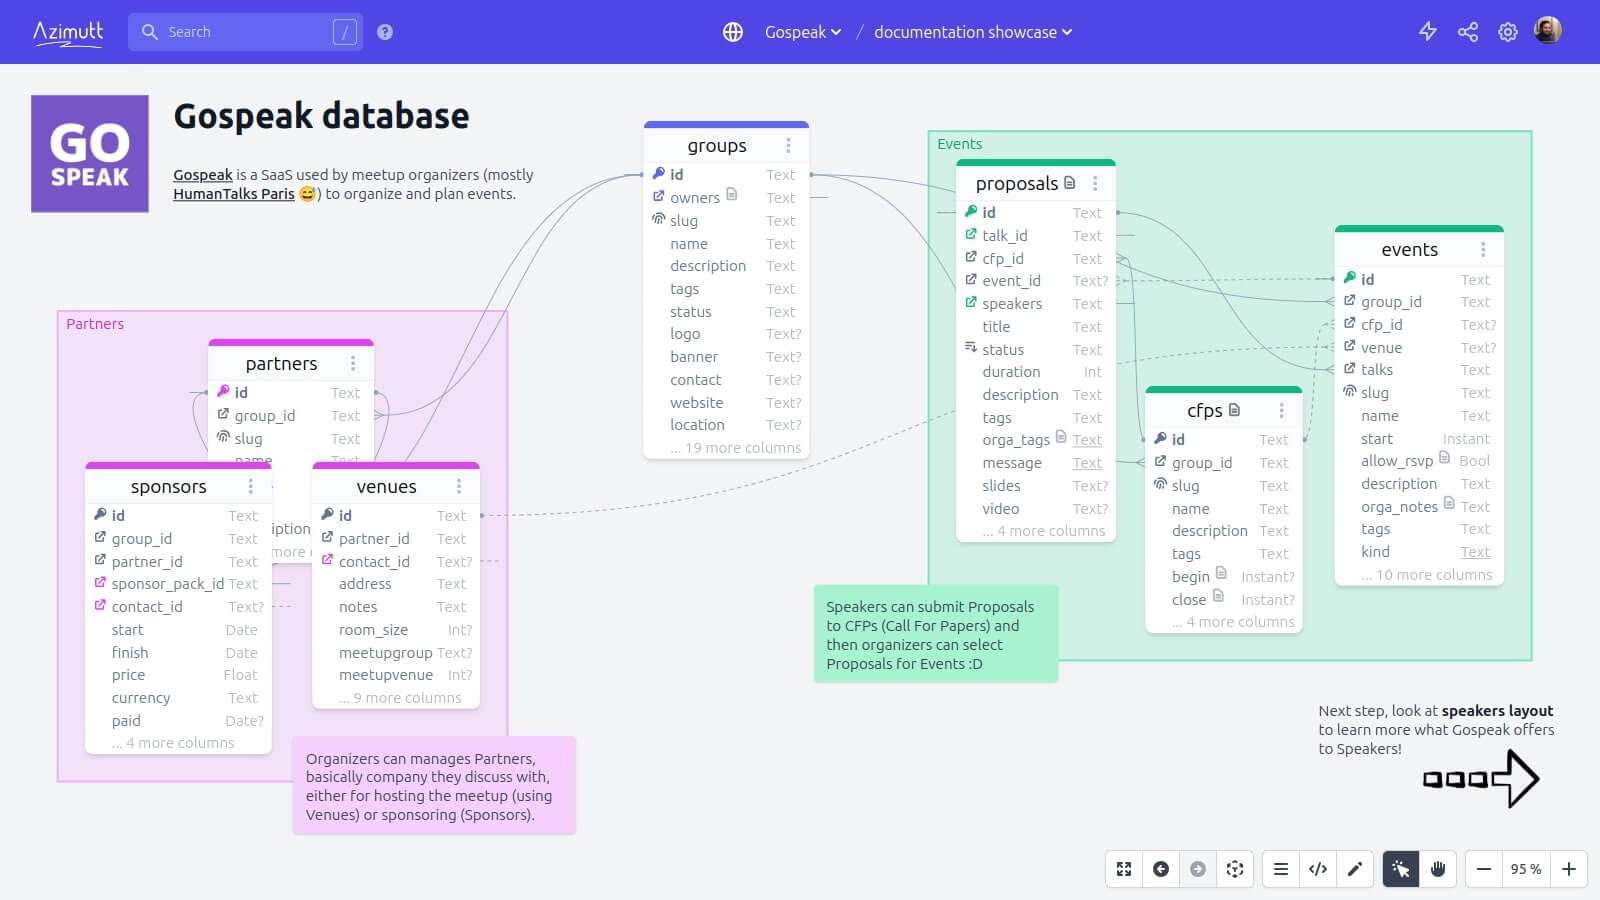
Azimutt is a database exploration and documentation tool designed for large and complex databases. While it supports schema visualization in a simple way, it goes beyond by enabling users to connect to a database, explore it (schema and data), make nice documentation, and even suggest improvements.
Pricing #
DrawSQL
DrawSQL has a Free plan but your work will be public, and you are limited to 15 tables.
The Starter plan is at $19/month with 50 tables allowed, the Growth plan at $59/month for 5 users and 100 tables, and there is an unlimited plan at $179/month.
Azimutt
Azimutt is Open-Source (MIT)
with the code available on GitHub (give us a star 😉).
You can use it on your own, use the online Free plan or buy a license either for Cloud or On-Premise, depending on your requirements.
The Solo plan is at 9€/month (unlimited tables), the Team plan at 42€/user/month, and there is an Enterprise plan if you have higher or custom needs.
More details on our pricing page.
How DrawSQL and Azimutt compares? #
At first glance, they can appear quite similar, both doing gorgeous diagrams. But this apart, they differ a lot and your experience with one or the other will be really different. Let's dig in.
Diagram definition: UI forms vs dedicated language #
When starting with DrawSQL and Azimutt, the first difference you notice is how you define your schema.
In DrawSQL, like in many other ERD tools, you have guided forms to create a table, then create a column, then define column name, type and settings.
In Azimutt, the diagram schema is defined using AML, a language specifically made for this.
This provides a vastly different editing experience.
Guided forms are a great fit for less technical users discovering how to define a database schema, they can be quite reassuring.
AML, on the other hand, may be more impressive at first as you will start from a blank state and require a bit of learning (like 1 minute ^^).
But once used to it, your design speed will be higher (>2x in our tests 🤯) and text editing unlocks copy/paste, search/replace... that are out of reach with UI forms.
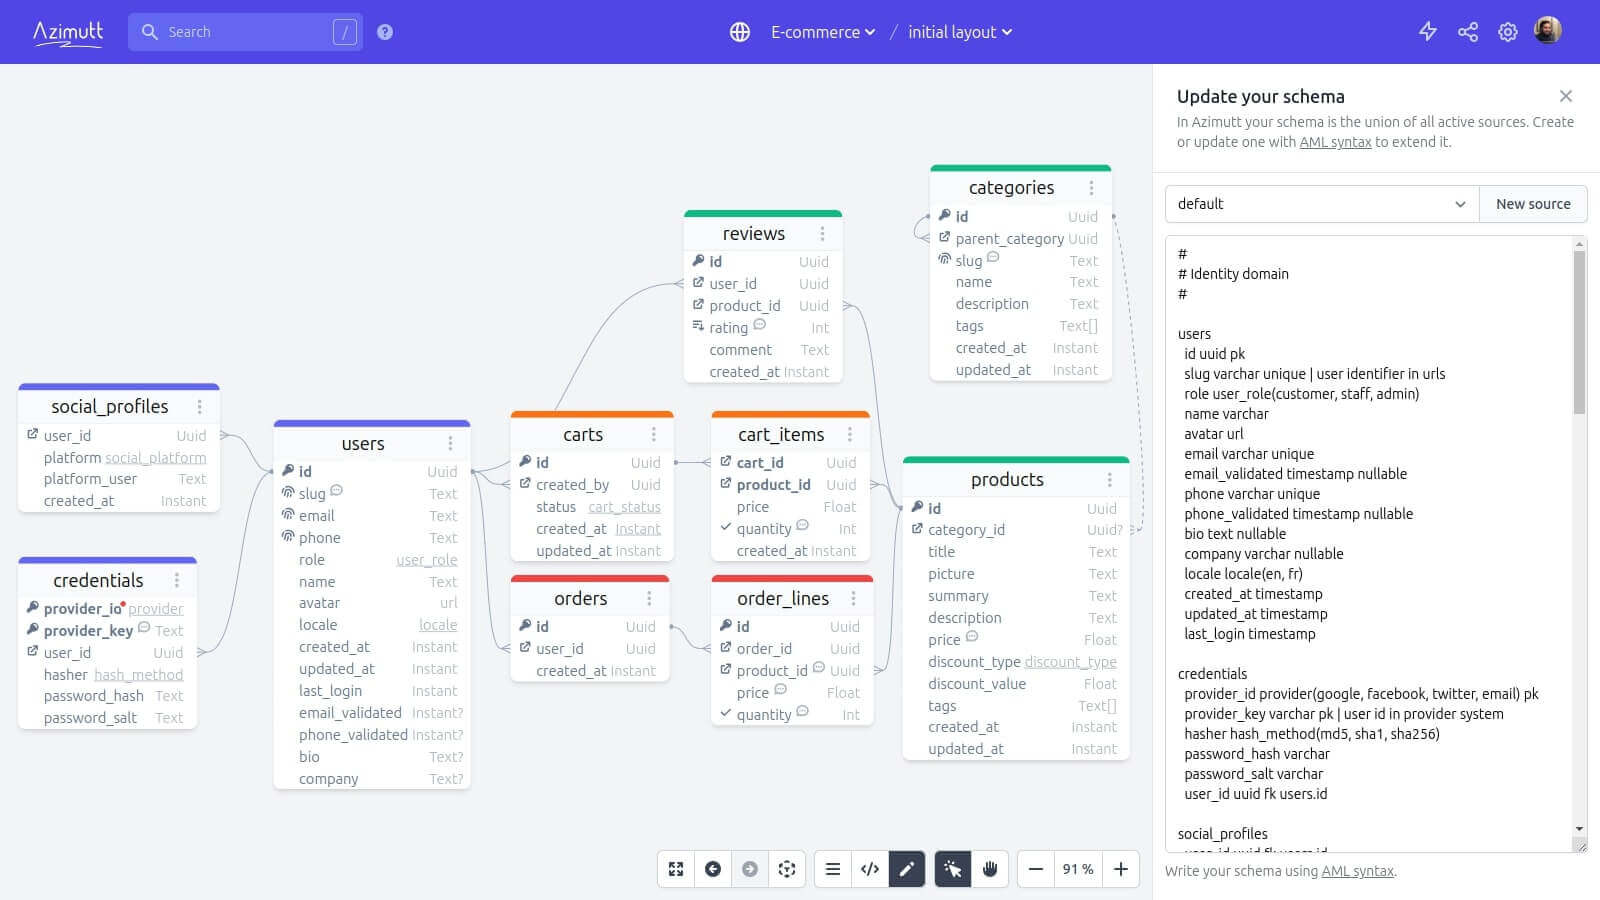
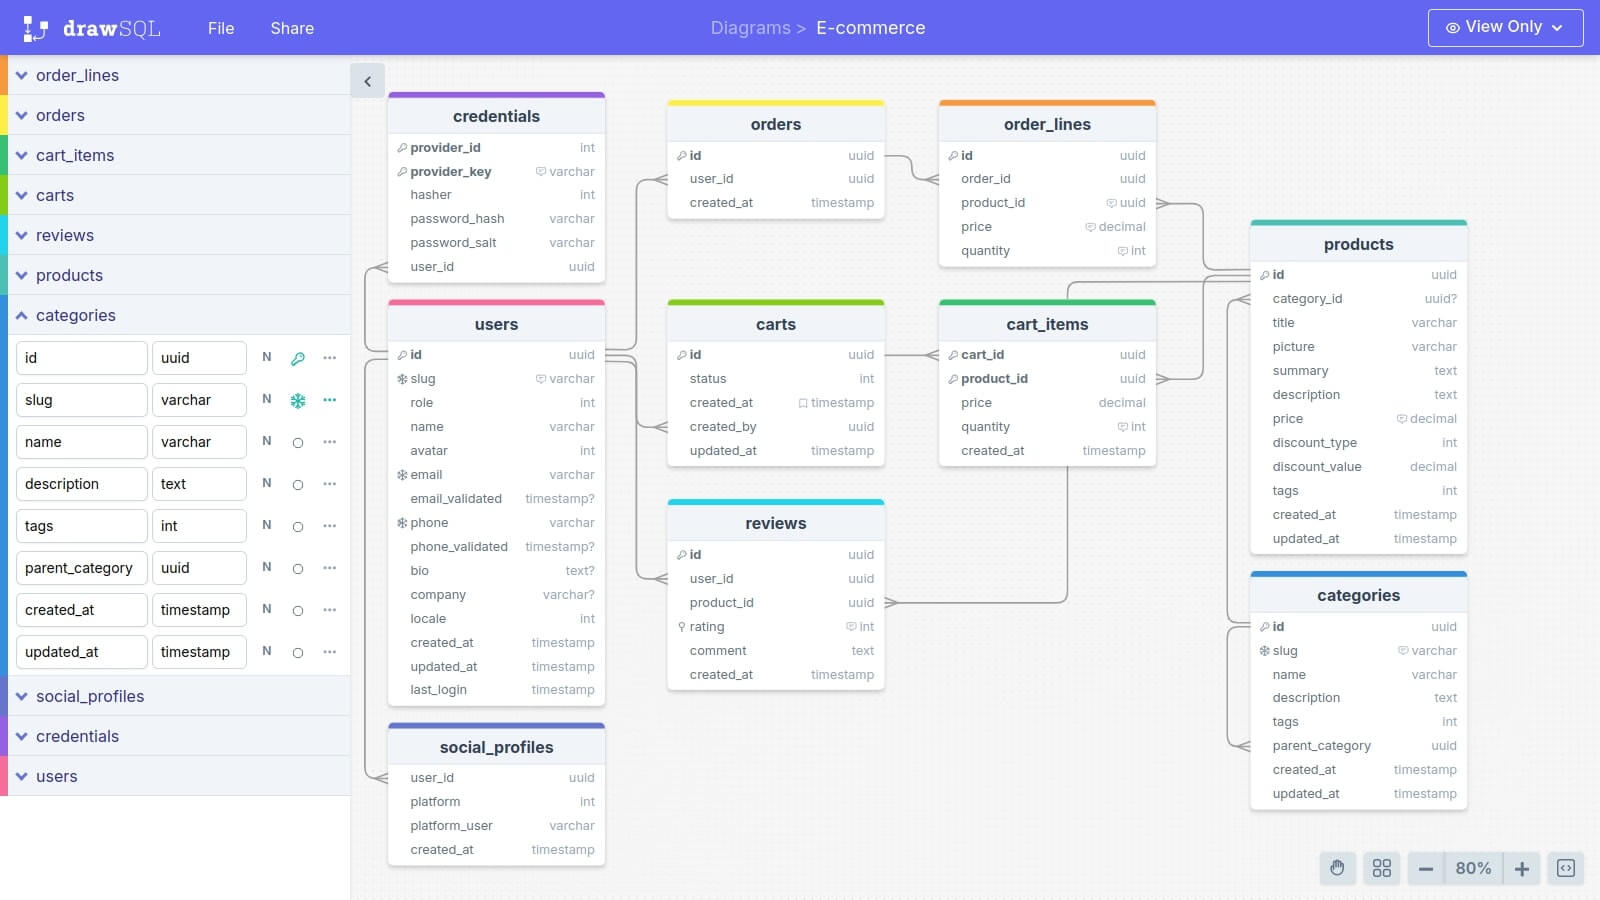
For small diagrams it doesn't make a huge difference, but for bigger ones it can have a big impact. One trick if you want to use DrawSQL but with AML: you can use the AML to PostgreSQL converter to write AML and get PostgreSQL code to import into DrawSQL 🤫
Single vs Multi layouts #
Another huge difference between DrawSQL and Azimutt is the single vs multi layouts.
Like many ERDs, DrawSQL display THE database diagram with every table and column shown on a single layout.
While totally fine when starting out, or with small and simple databases; it can be quite annoying if you have a lot of tables or even some tables with a lot of columns.
And this is often the case in real world databases.
Azimutt on the other hand, allows you to create and organize any number of layouts where you choose which tables and columns are shown.
So you can create diagrams focused on use cases, showing only the relevant parts of your database.
A single layout is usually manageable with less than 50 tables, if they have usually less than 20 columns.
Database access #
Like stated in introduction, Azimutt is not just a database schema diagramming tool but rather a complete solution to explore and understand large and complex databases (who said legacy? 😅).
As such, it needs to follow schema evolutions of the database (source refresh), connect to several databases at once (multi-sources) and even query data to dig beside the schema alone.
Azimutt even do the extra step of analyzing your database and suggesting improvements such as missing or duplicated indexes and relations, but also checking for inconsistencies in naming, column types and data.
When to choose DrawSQL or Azimutt? #
If you need to draw a simple diagram with a tool only focused on that, DrawSQL with give you one of the nicest result out there. It doesn't need any install, just an account, and it's great for schemas with few tables (free until 15 tables) like side-projects or small apps, or documentation/tutorial illustrations.
If you already have a database with tens of tables, Azimutt will most likely be more suited for you.
Especially for automatic schema updates as the database evolve but also have use-case focused layouts with documentation and maybe even query your data directly from Azimutt.
As an Open-Source tool, you can suggest improvements and even contribute yourself adapt it to your needs if they require small adjustments or are not yet met.
As a conclusion, we believe Azimutt is a great alternative to DrawSQL, even for simple projects if you like the AML editing experience. In either way, you can give a try to both of them for free. And even Azimutt paid plans as they all have a 2-week free trial period to try advanced features!
If you need inspiration, you can check the Azimutt Gallery for projects, simple or complex, built on purpose or from popular projects. For a really complex setup, check the e-commerce demo with 85 tables over 9 databases. Some of our clients even have over 3000 tables handled in Azimutt 😱
