Finding the right tool for the job can clearly be a game changer. And when looking for a visual tool for your database, you will always find Entity-Relationship Diagrams (ERDs) on your way. Either strict ER diagrams with all the correct notations or kind of ER diagrams, just having tables and relations but without all the semantics of an ER diagram.

As the offer is huge (here is a list of 79 Data Modeling Tools Compared, and it’s far from complete), focus on the task you want to achieve to choose a category, then try out a few ones. No need for exhaustivity here, just know where to look and find one that does the job.
After looking at a lot of them, I could identify 4 categories or relevant tools (leaving many on the side as they are quite outdated). Here are the categories and the best ones I found in each of them:
Drawing tools
As Entity-Relationship Diagrams are primarily diagrams, no surprise we find here diagramming tools. They may have dedicated assets for ER diagrams and their main selling points here are their flexibility and design capabilities. If you are looking for an online pen and paper to draw your database schema, they are the tool you need.
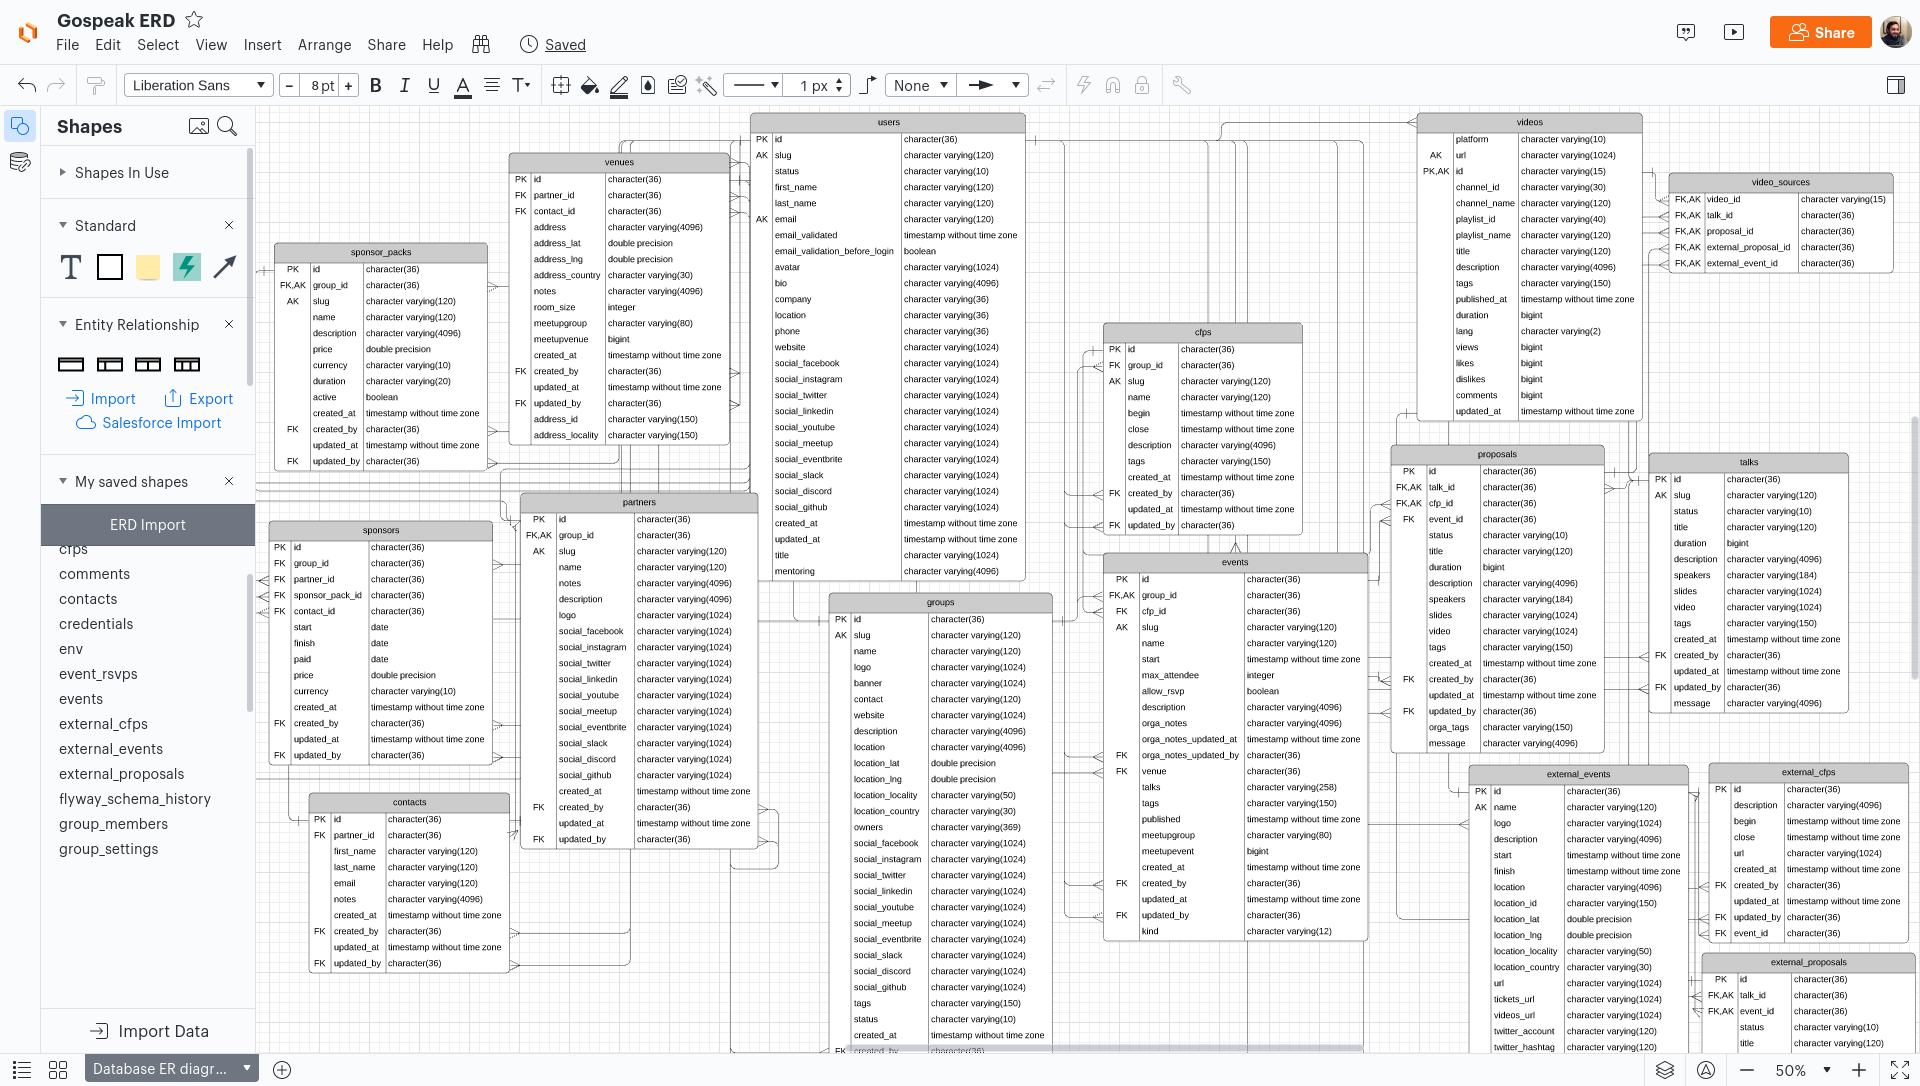
Lucidchart
https://www.lucidchart.com/pages/examples/er-diagram-tool
price: free for 3 documents
As a drawing tool I didn’t expect much but had a good surprise. The SQL import was quite easy, and the fact it generated tables as saved shapes helped a lot to manually add them in the canvas (instead of having everything loaded from scratch and figure it out). As a drawing tool you can customize everything, and you can surely create beautiful diagram, but it will take a lot of time.
Good points:
- has SQL import, but as paid feature
- you can add/change anything you want in the diagram
Missing ones:
- has a lot of things, a bit overwhelming the first time
- you can create good things but everything is very manual, doesn’t scale well
- the editor is very slow, edit experience is not very good
My recommendation: If you are already a Lucidchart user or if you want to create a printable chart with other visuals than just your tables and relations such as a title, some comments, images or arrows, it can be a great option with the page settings and structure import. Still use it mostly to build a static diagram, not to work daily with your database.
Excalidraw
price: free
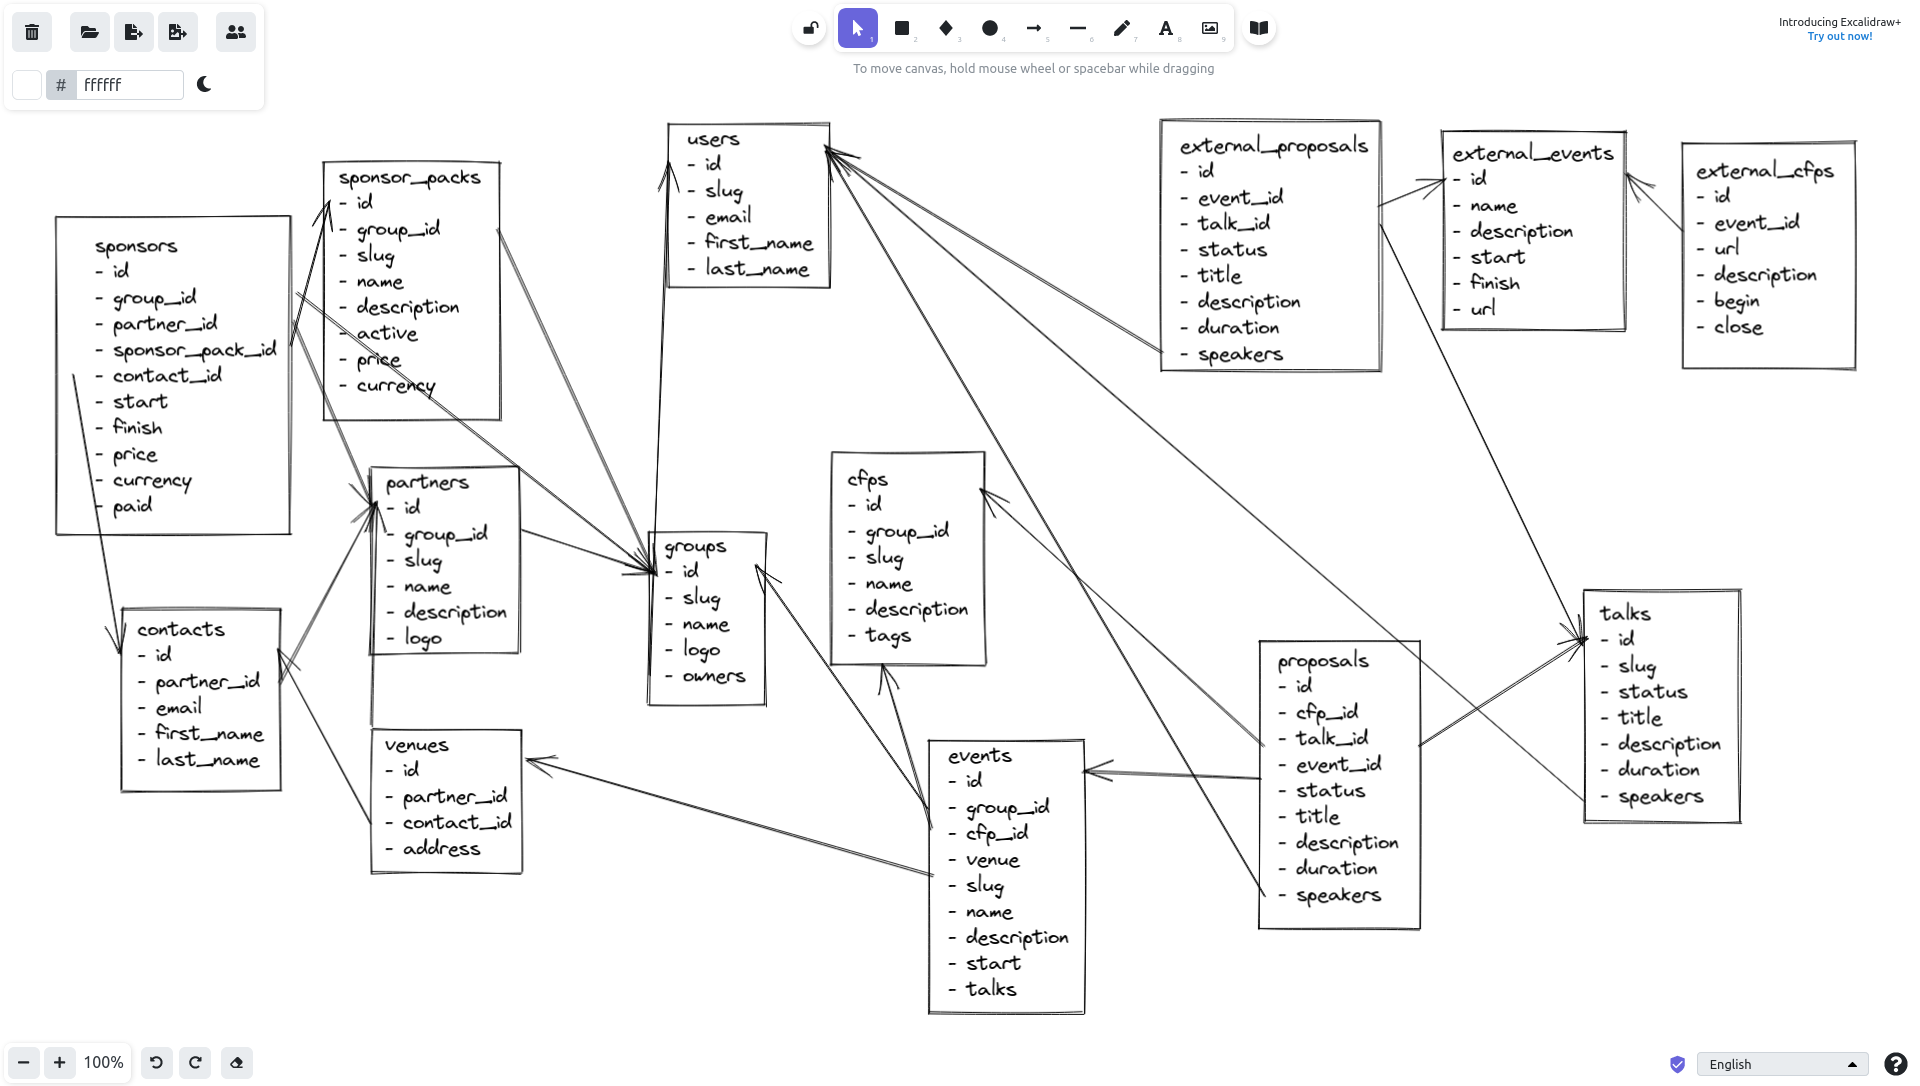
This one is the simplest drawing tool, you just have some text, boxes, arrows and a few more things. With it, you focus on your content instead of the tool. Very basic, very effective. But also quite fuzzy for an ERD… 🙃
Good points:
- blazing fast
- no learning curve
Missing ones:
- almost everything ^^
- forget about precision or exhaustivity, welcome sketches
My recommendation: If you are looking for a blank canvas where you can draw what you have in mind, without constraints, this is probably your go-to tool. No time spent looking for the perfect shape, loosing your thoughts.
Database clients
On the opposite of drawing tools, database clients are directly connected to a live database and allow to perform any kind of querying or manipulation of your database. They often offer some ERD capabilities, but as a side feature, often basic and not really usable with more than a few tables. If you regularly work with databases, you probably already use some.
Datagrip
https://www.jetbrains.com/datagrip
price: 10.68€/month
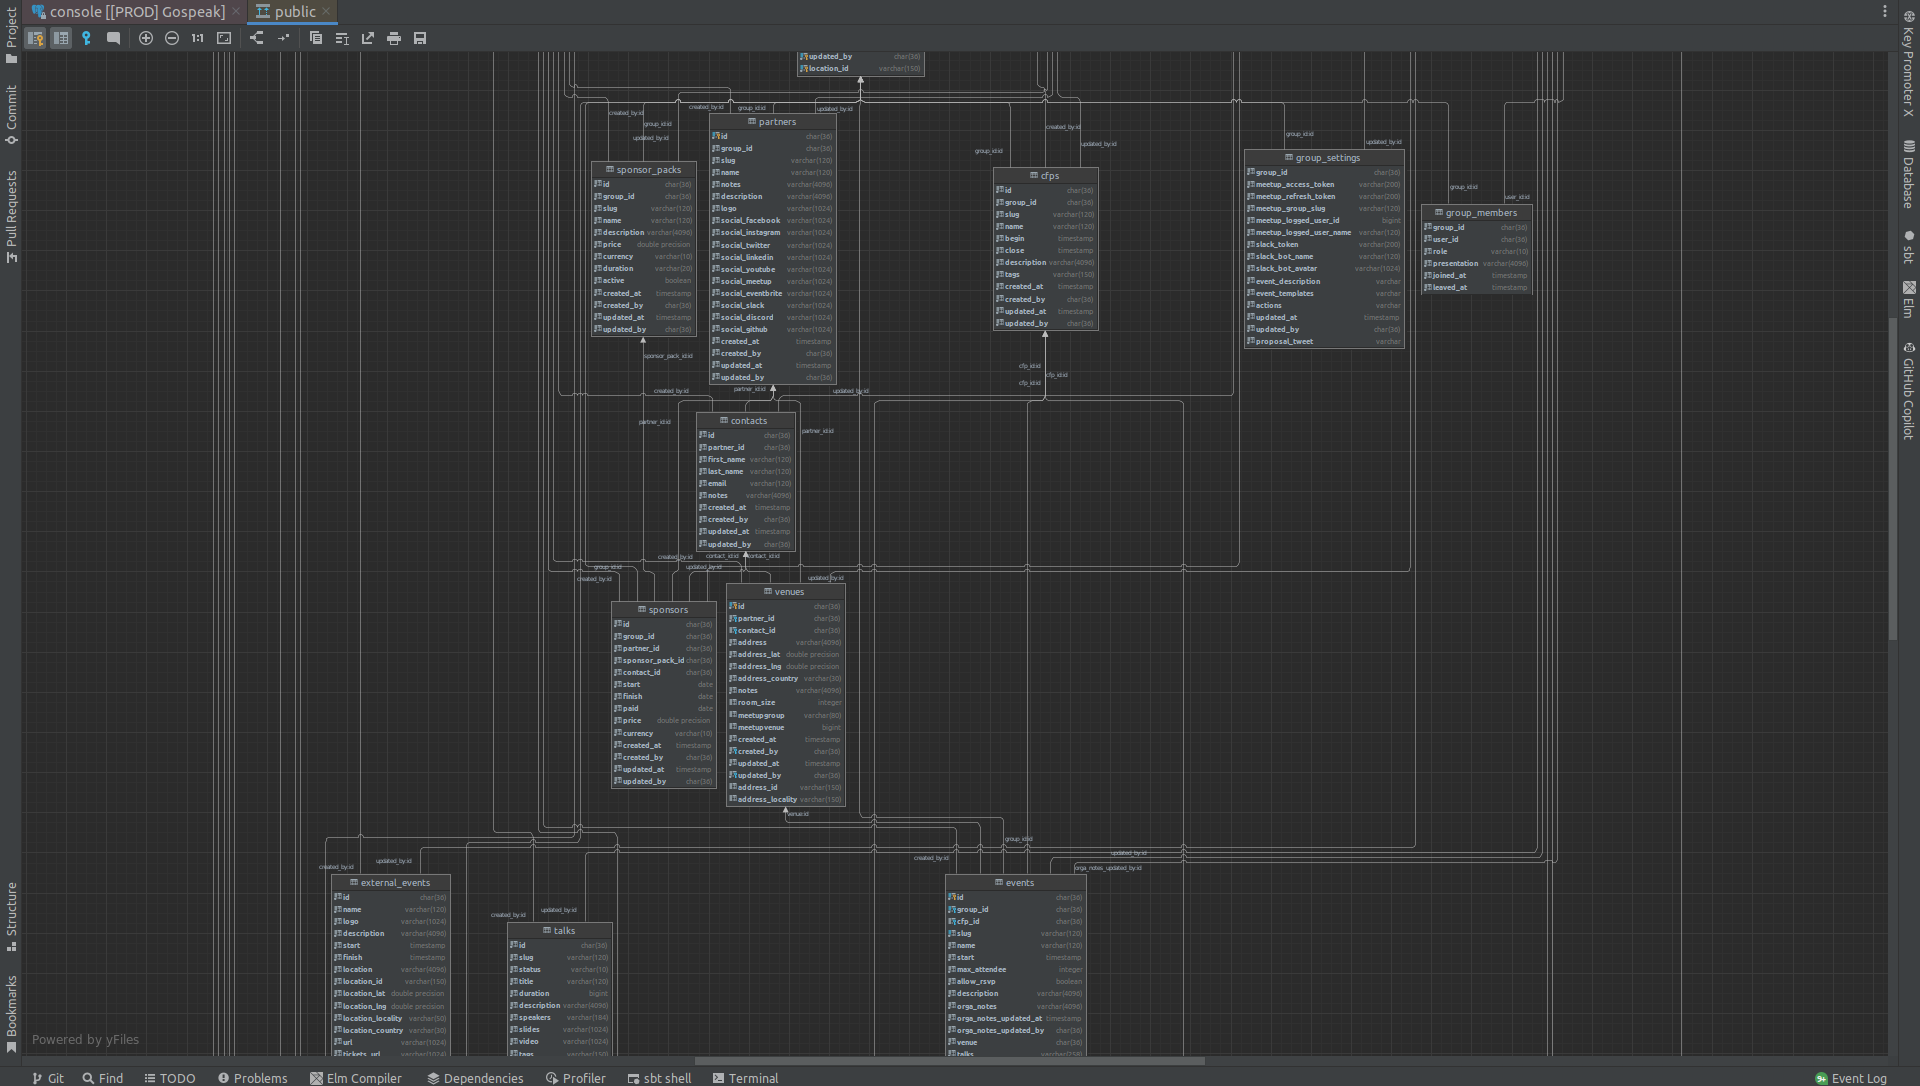
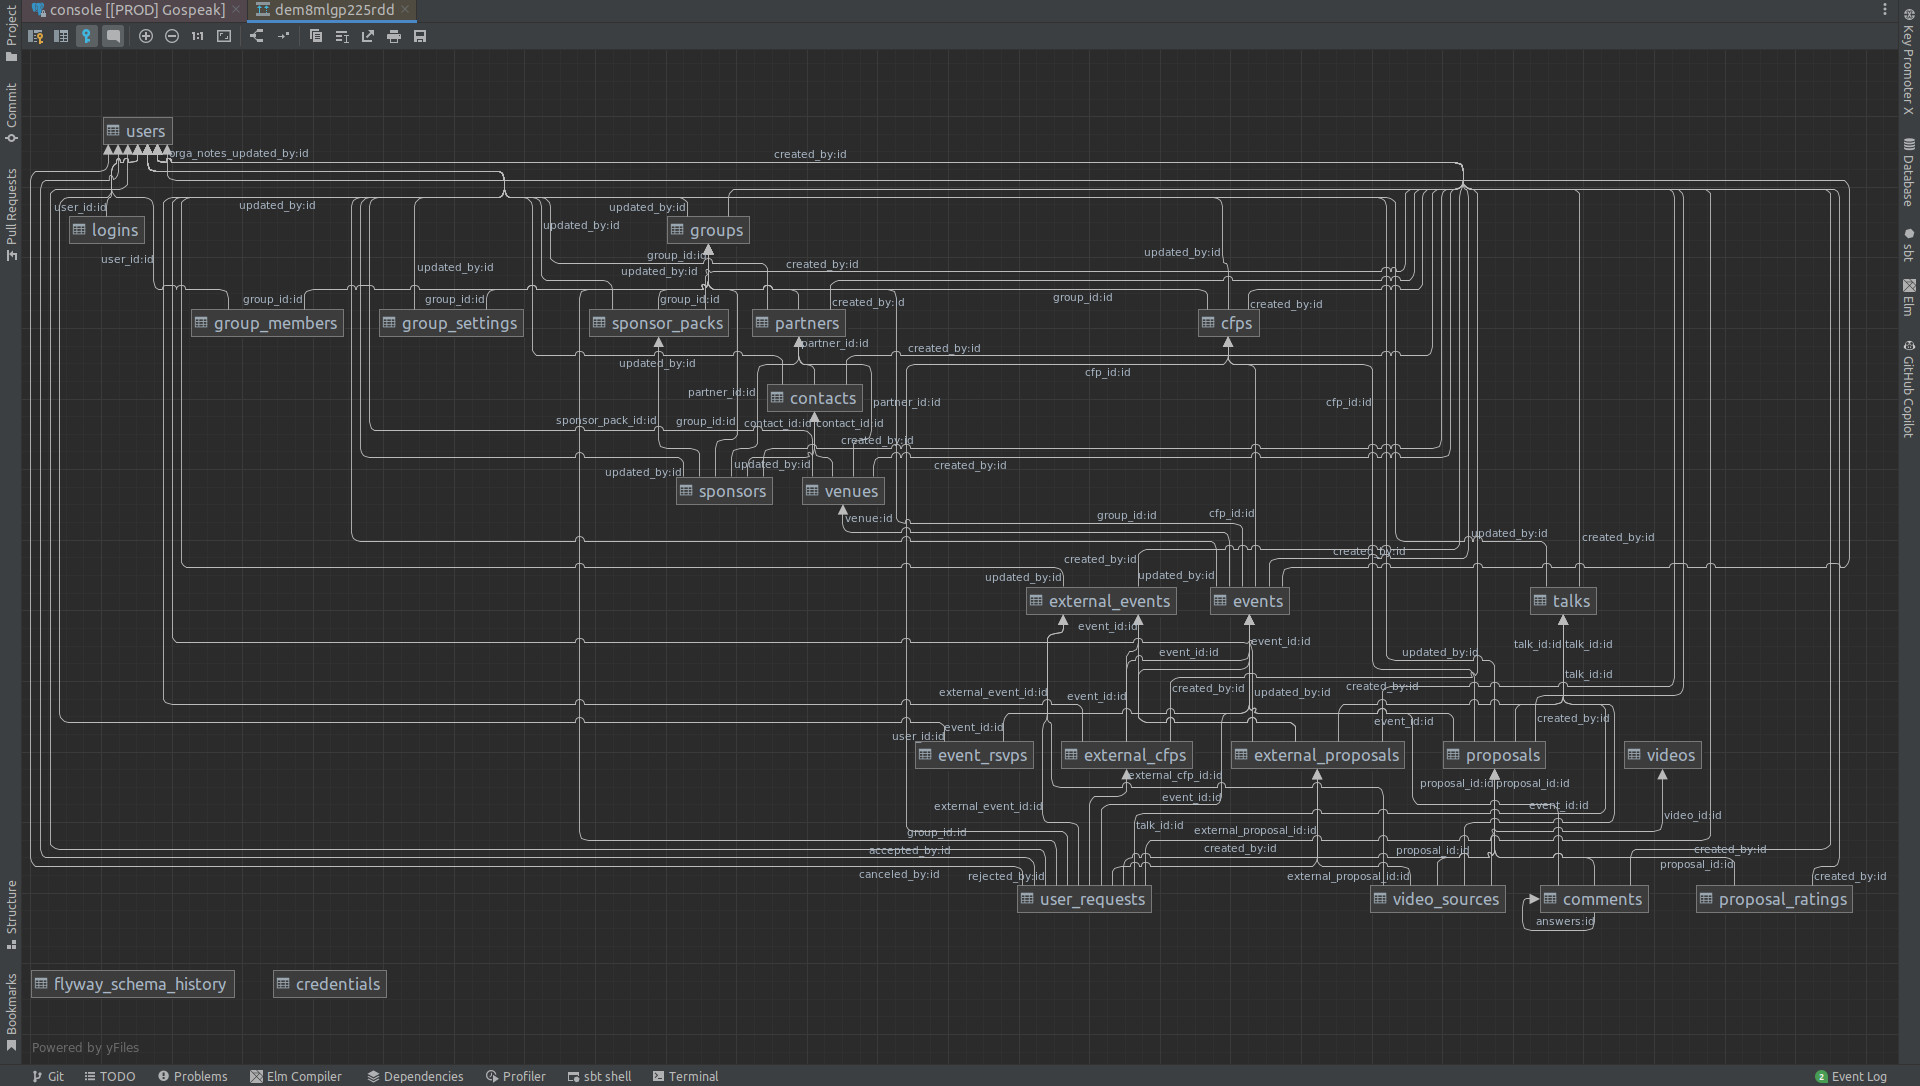
Datagrip is primarily a database client, allowing you to connect and query all of your databases. It’s quite good for that and as it’s integrated into IntelliJ IDEA IDE, so it’s my daily tool for this. It also offers an ER diagram with a quite good auto-layout. But everything is displayed right away which make diagrams hard to read and understand, even for small side projects like Gospeak (26 tables).
Good points:
- already connected to your database if you use it as database client, so very easy to get your diagram
- you can hide columns in the diagram making it much more readable
Missing ones:
- no easy way to navigate into the schema
- there is a lot of details that makes the diagram hard to read
My recommendation: Regarding diagrams and database exploration, just forget it. But for database querying inside your IDE, it’s the best tool here, but that’s not this article topic ^^
Toad
https://www.toadworld.com/products/toad-data-modeler
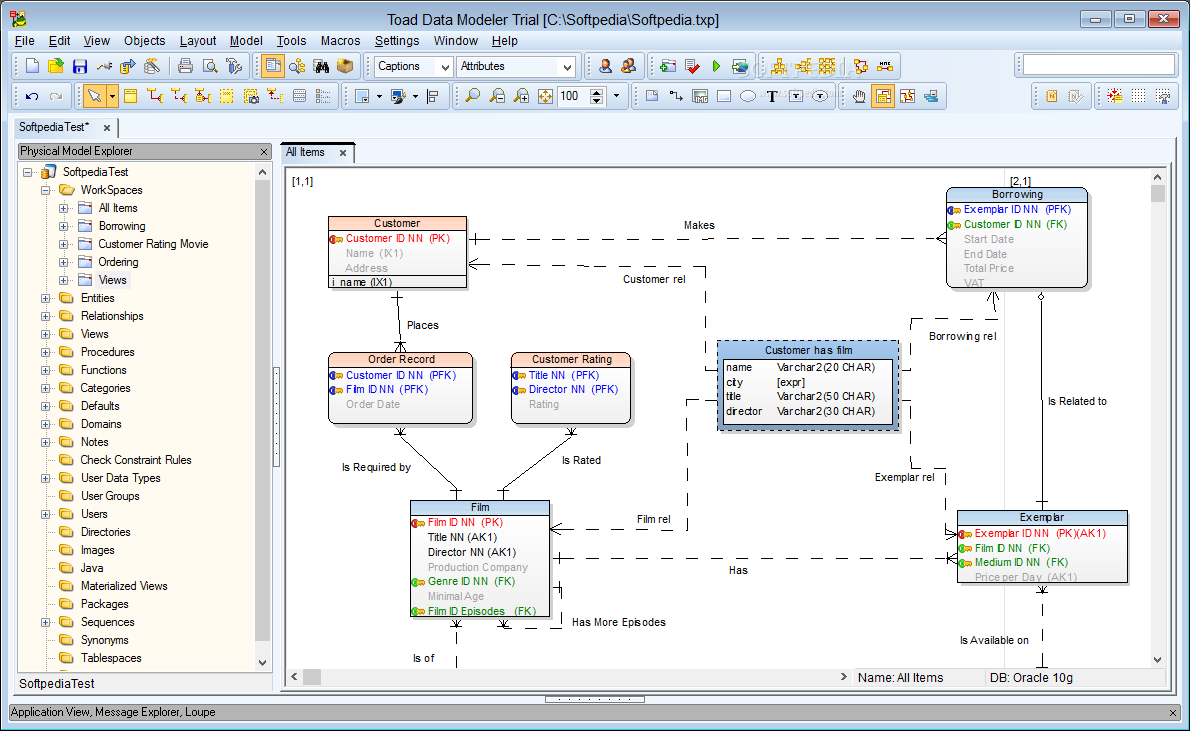
price: 275€/year, 30 days free trial
Sadly I couldn’t test it as I’m on Ubuntu and can’t find a Toad version to run, and I didn’t want to remove it from here as I heard good feedback on it so here it is… If you are on Windows, feel free to test it and see how it goes. From the screenshots I have seen, it seems a bit old school but maybe has some interesting features.
MySQL Workbench
https://www.mysql.com/products/workbench
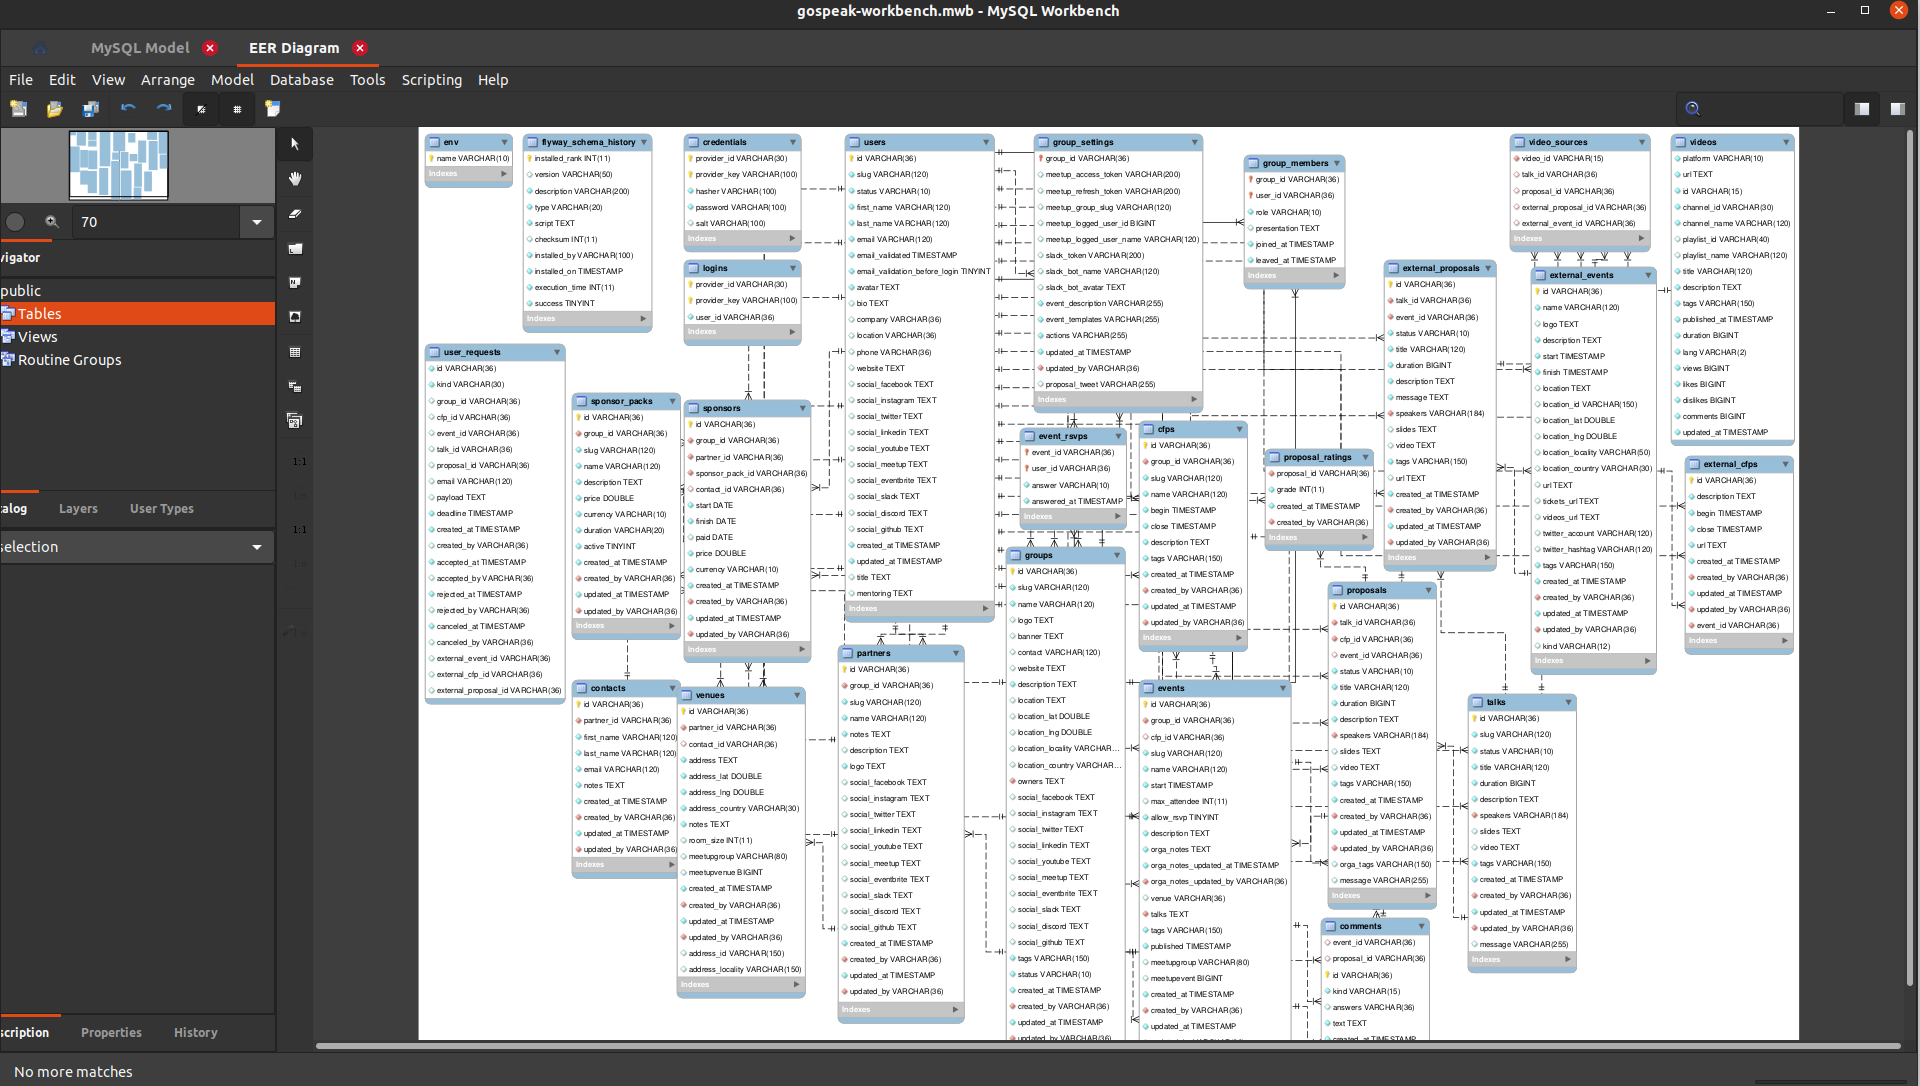
price: free
Like all database clients, MySQL Workbench has to be installed on your machine. Its diagram feature seems quite nice when you look at screenshots, and it has very interesting features such as table groups and free floating text. Sadly it’s hardly usable: diagram size is limited, table groups does not interact with tables (just visual areas) and actions are hard to use.
Good points:
- clear UI
- table groups and text
Missing ones:
- diagram canvas is limited
- specific to MySQL
- hard to use
My recommendation: If you want a diagram, and already use it, let’s give it a try, but otherwise, you will have better success with other tools as it’s quite old school and deceptive (promising feature but not really usable in practice). Maybe the querying tool works well but this is not the topic of this article.
Database creation tools
Between drawing tools and database clients, we have several diagram tools, aiming to ease the database creation using visual diagram. They often are not strictly Entity-Relationship Diagrams but take them as inspiration to show tables and relations. They are often SQL aware and propose import/export of SQL scripts along with diagram building which is their main feature.
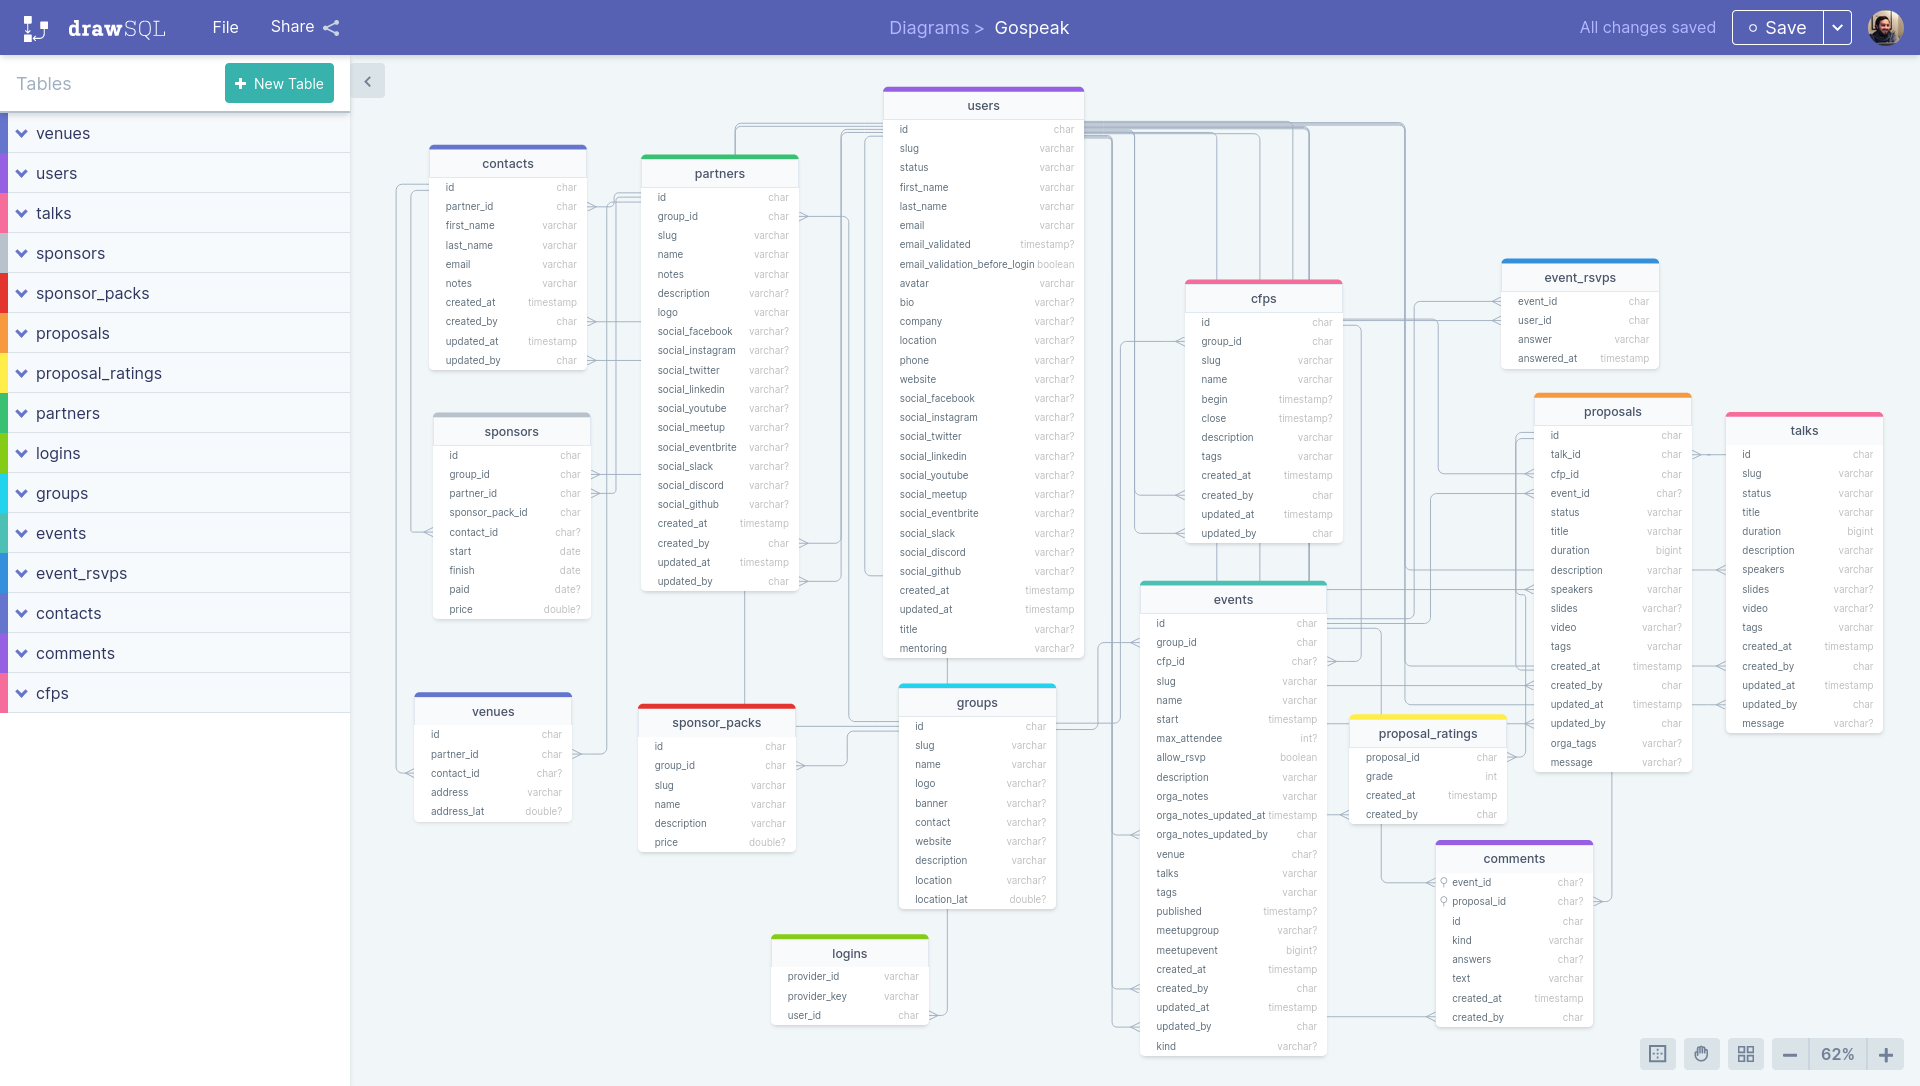
DrawSQL
price: free (< 15 tables), then starts at 15$/month
DrawSQL is one of the nicest tool out there which makes it pleasant to work with, and it has a huge sample gallery so, it can be interesting for you to take some inspiration. It also has some versioning on paid plans, which may be very helpful. Finally, it offers good collaboration options, and you can even embed your diagram:
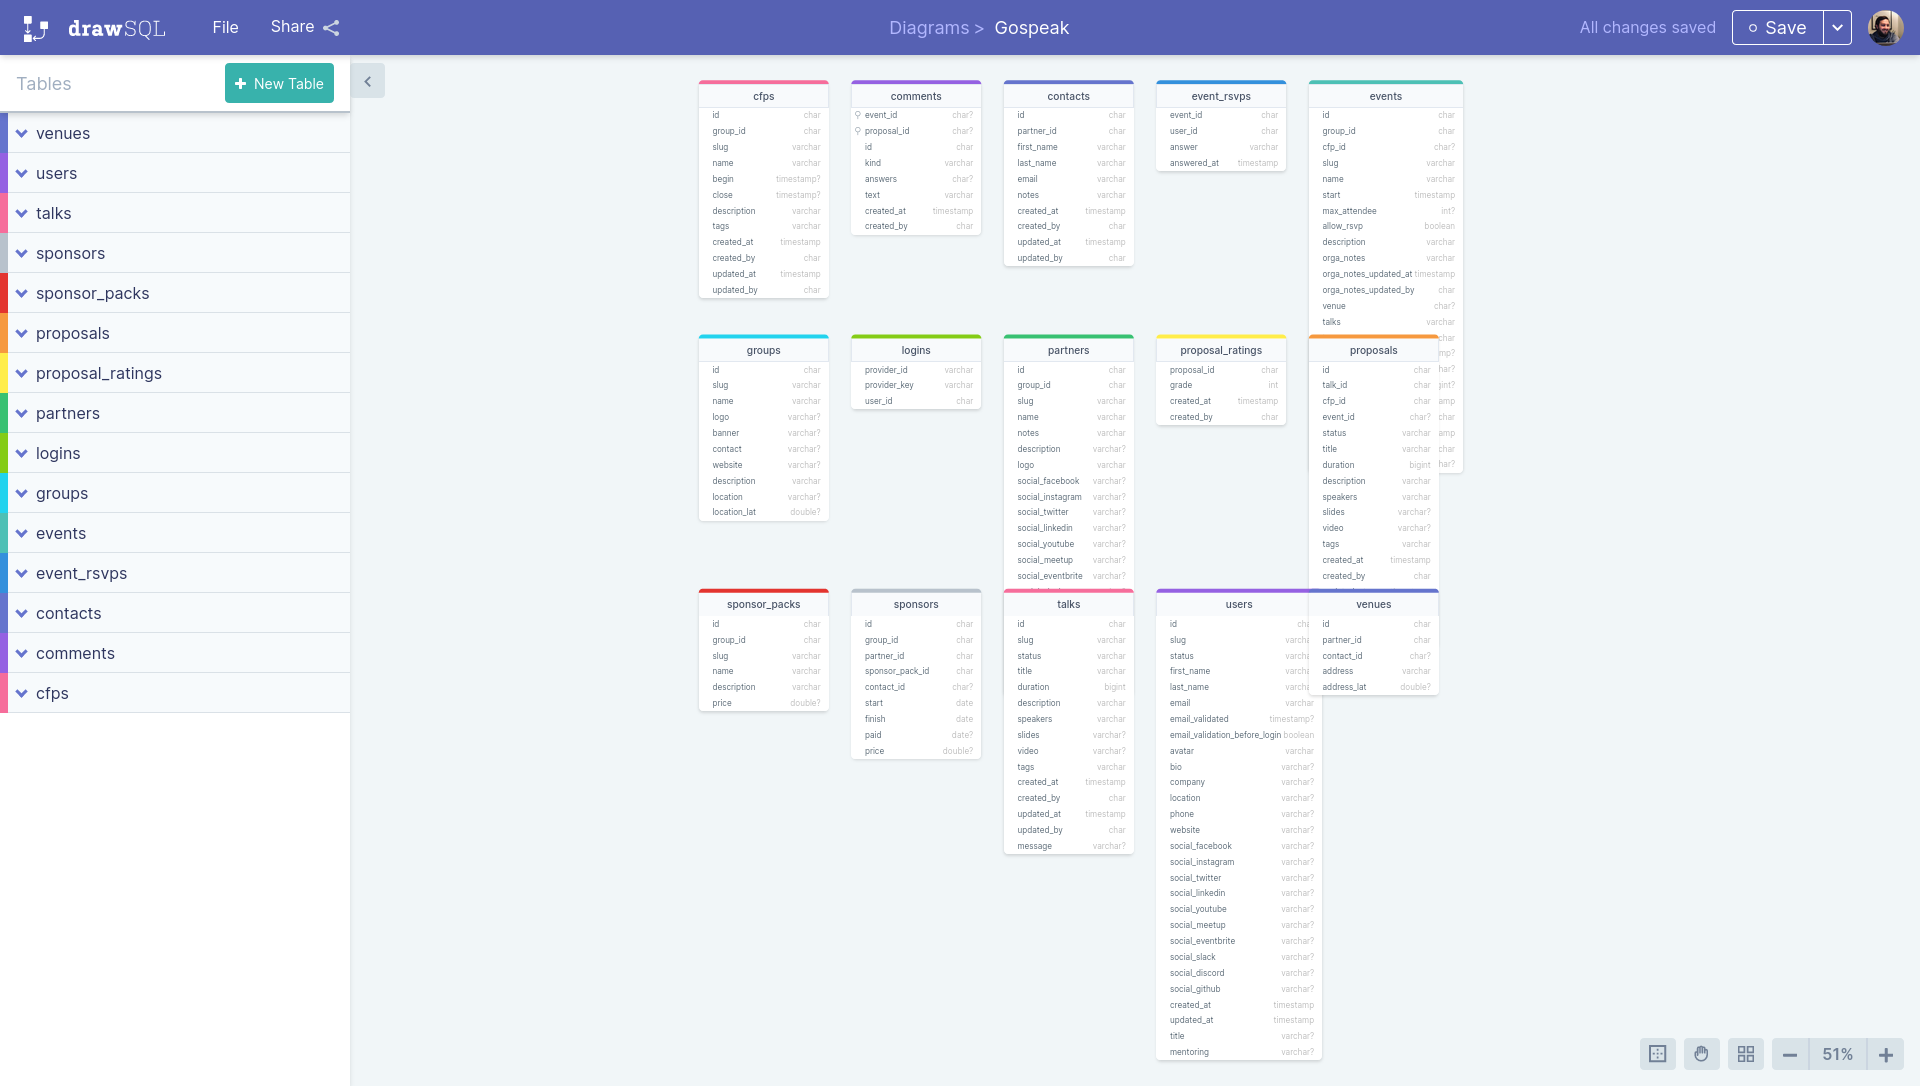
On the less good side, the import feature is not as good as expected: it only parses CREATE TABLE and CREATE INDEX statements, which missed all the relations (defined with ALTER TABLE) but also a few columns, and I can’t find why. Here is my import result (to compare with the re-worked diagram just above):
Good points:
- beautiful
- creating tables, columns and relations is very easy
- easily share your diagram
- diagram versions
Missing ones:
- parsing is not good which makes using it for an existing schema useless (missing relations and some columns)
- no auto layout
My recommendation: Want to draft your new database or a few tables? It’s a very good tool for that. Especially if you want to share it with other people as the diagram is very nice and you can embed it. Still, the import mode is quite useless in its current version so if you have an existing database schema prefer Azimutt or SqlDBM.
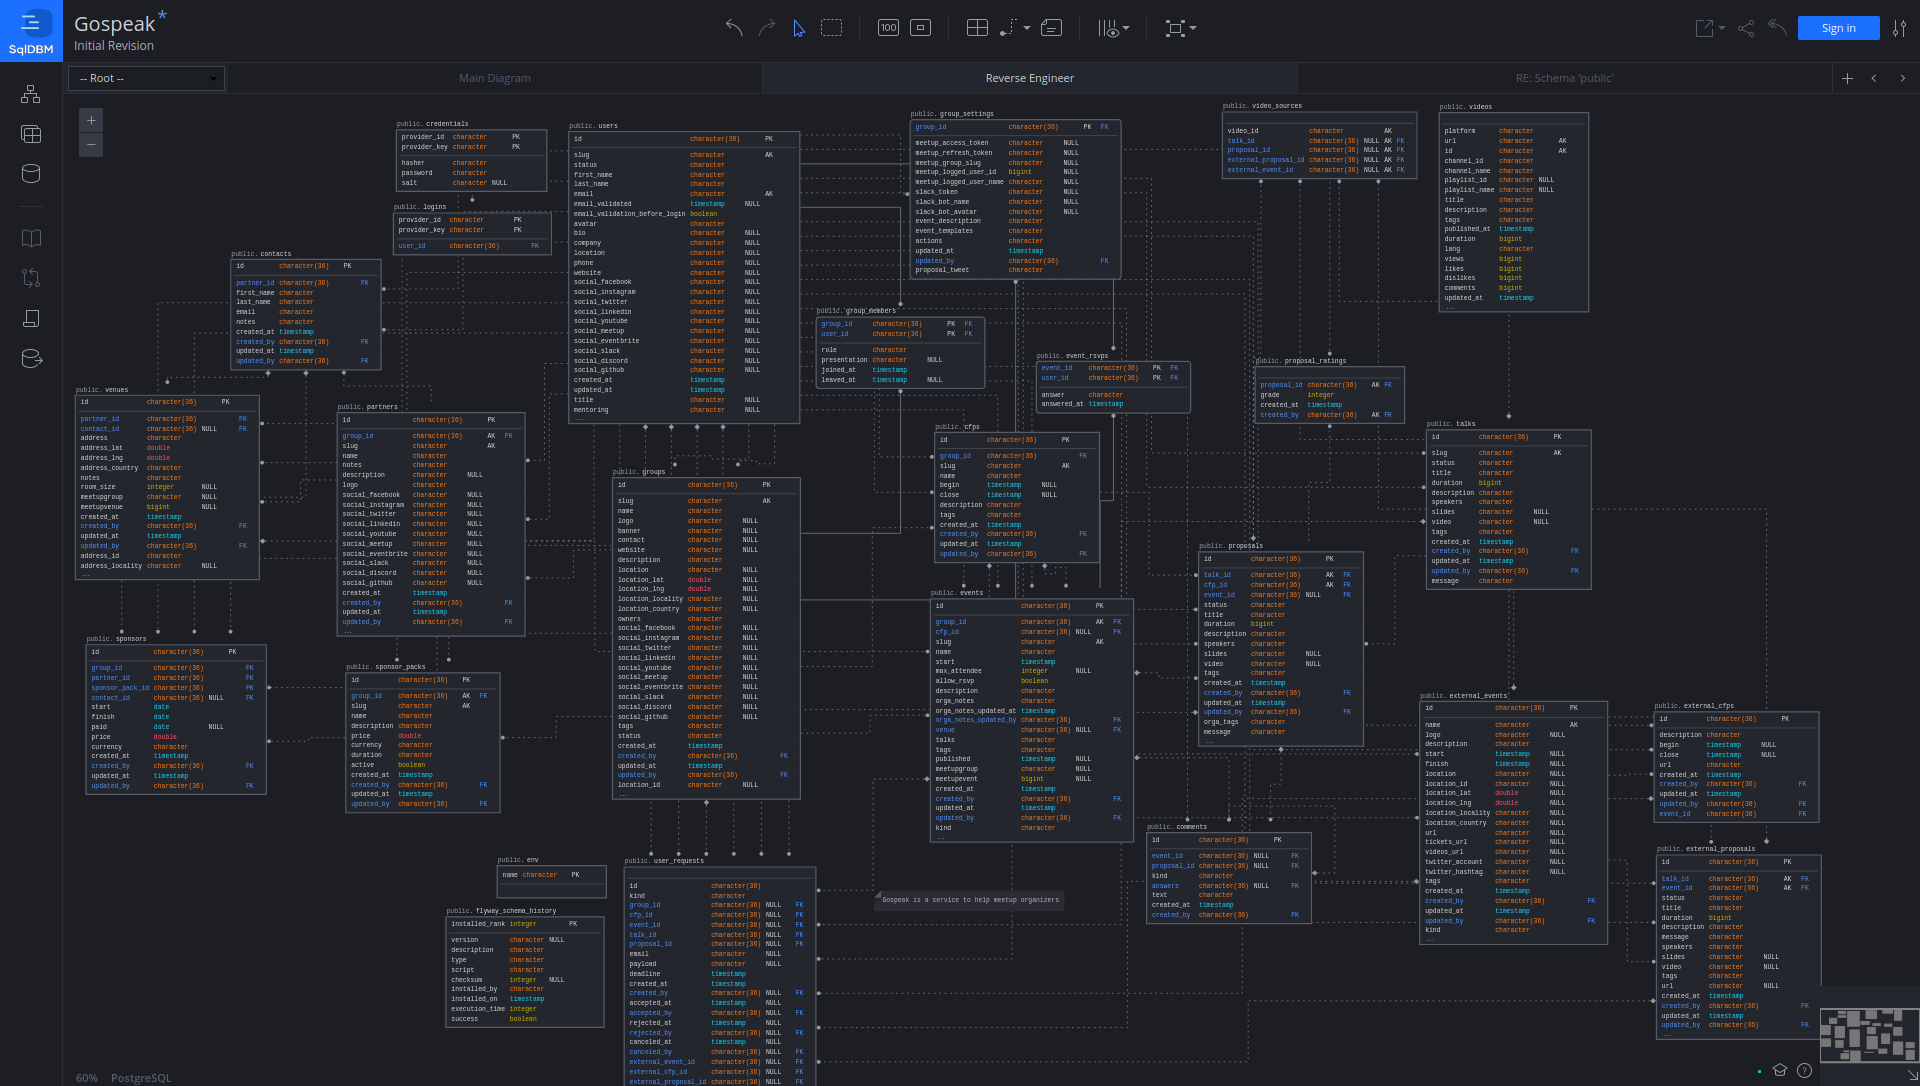
SqlDBM
price: 15$/month with a free trial
SqlDBM does a perfect job parsing and showing your database schema. Parsing works great and auto-layout capabilities help to start with, even if a manual placement is still required. It also has a “fixed object height” mode, showing only the first 15 columns so your diagram is not distorted by a table with many columns. It also has several nice ideas such as tables transparency when dragging one and free floating notes 👍️
Good points:
- multiple view mode: tables, keys, columns, descriptions
- several auto-layouts: star, top-down, left-right
- add free floating notes
Missing ones:
- there is some colors for foreign keys and types but all tables look the same and their name is quite small, it’s hard to distinguish them
- relations are hard to follow, their highlight is too subtle
My recommendation: If you are looking for a full-featured tool to explore your database and draw some evolutions, it can be your best choice, but only for limited size schema (< 40 tables), otherwise the lack of search and hide table is too costly to use it.
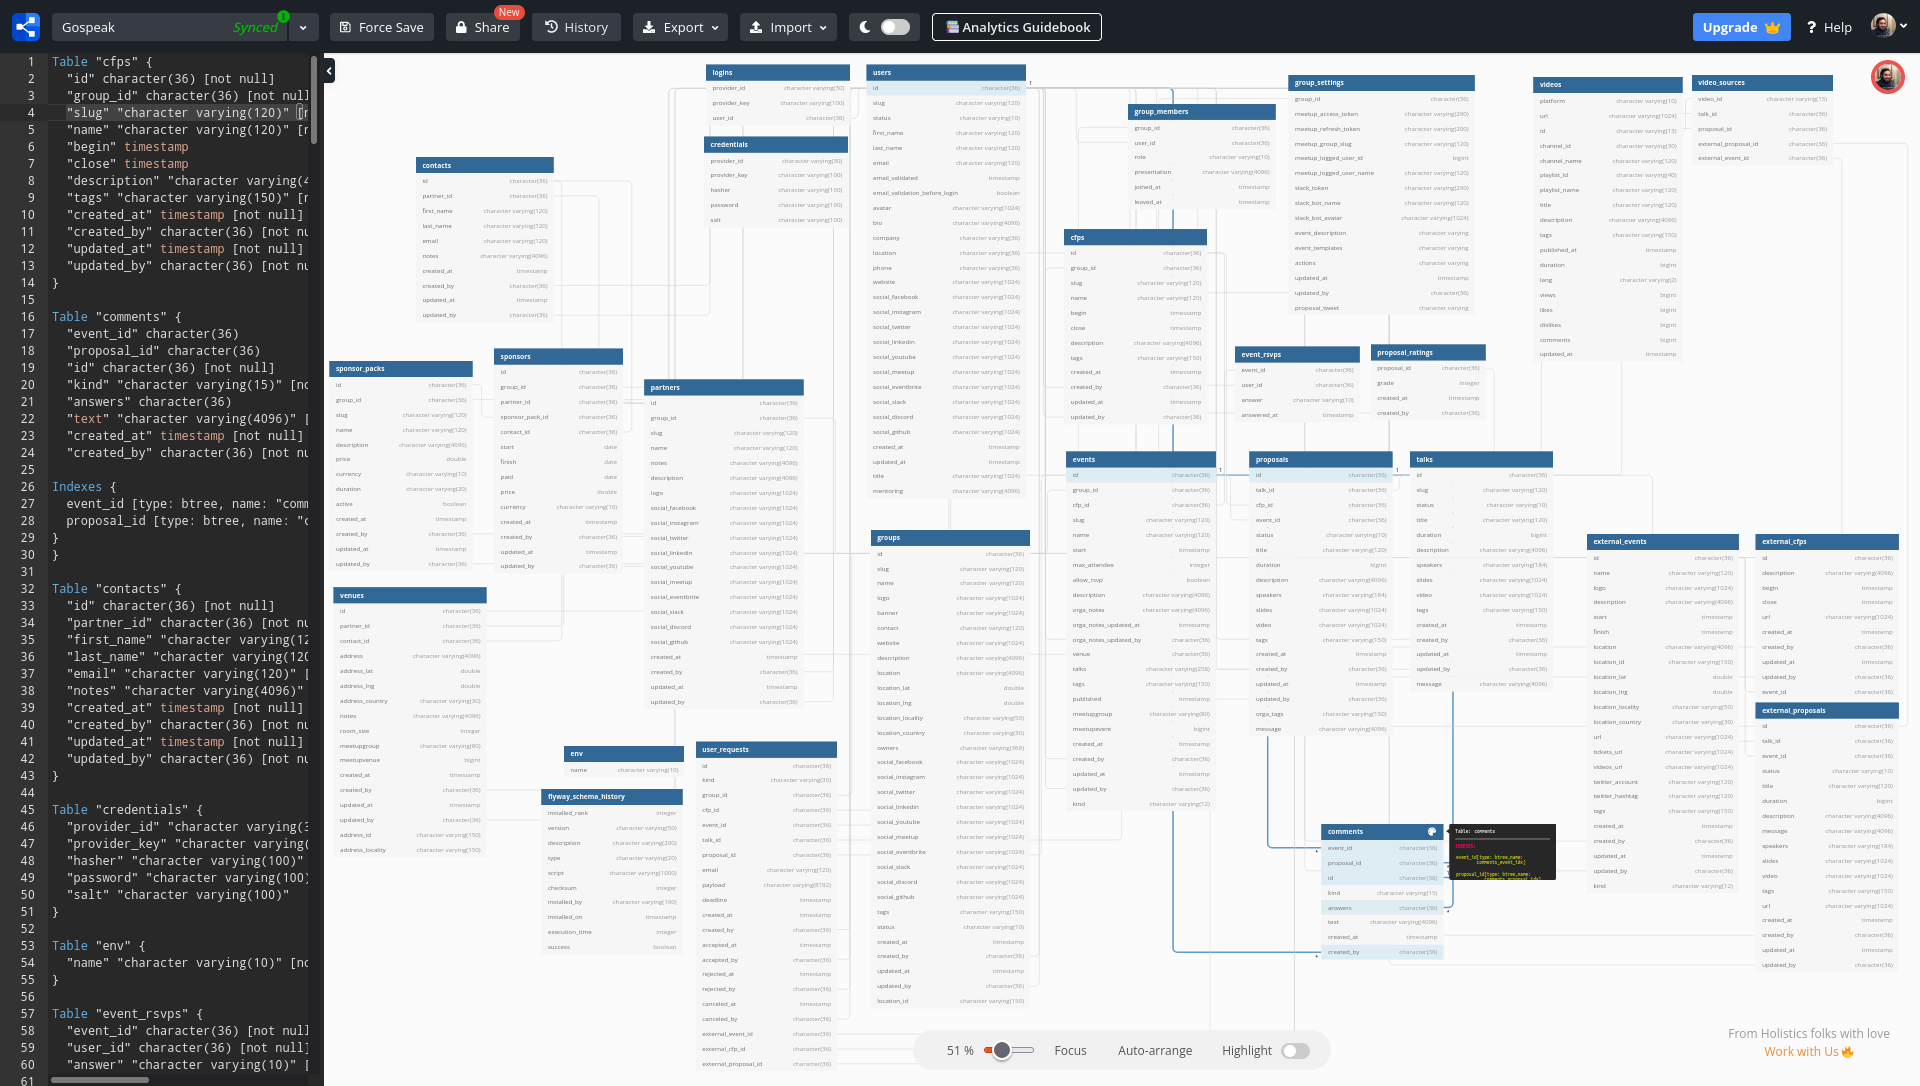
dbdiagram.io
price: free for public diagrams, 9$/month otherwise
Designing your database schema in plain text with a simpler language than SQL is an awesome experience: you express your ideas easily and don’t have to click every time you add a table, a column or a relation. The SQL import is working great, I had a few errors but could fix them in the editor, so it was quick. Table color, group and realtime collaboration are great, even if reserved for the pro users. Finally, the embed mode can bring a lot for documentation and collaboration.
Good points:
- DBML markup is great
- table colors and groups
- realtime collaboration
Missing ones:
- some key features are in pro mode: table color & group
- auto-arrange just sort columns alphabetically, not very useful
- hard to follow relations, even with the highlight
My recommendation: If you want to draft a few tables you have in mind, I think it’s the perfect tool. Even bigger schema are correctly loaded using the import feature but if they grow too much, it will be very tricky to organize them and be productive. But, definitely a tool to try for its original approach.
QuickDBD
https://www.quickdatabasediagrams.com
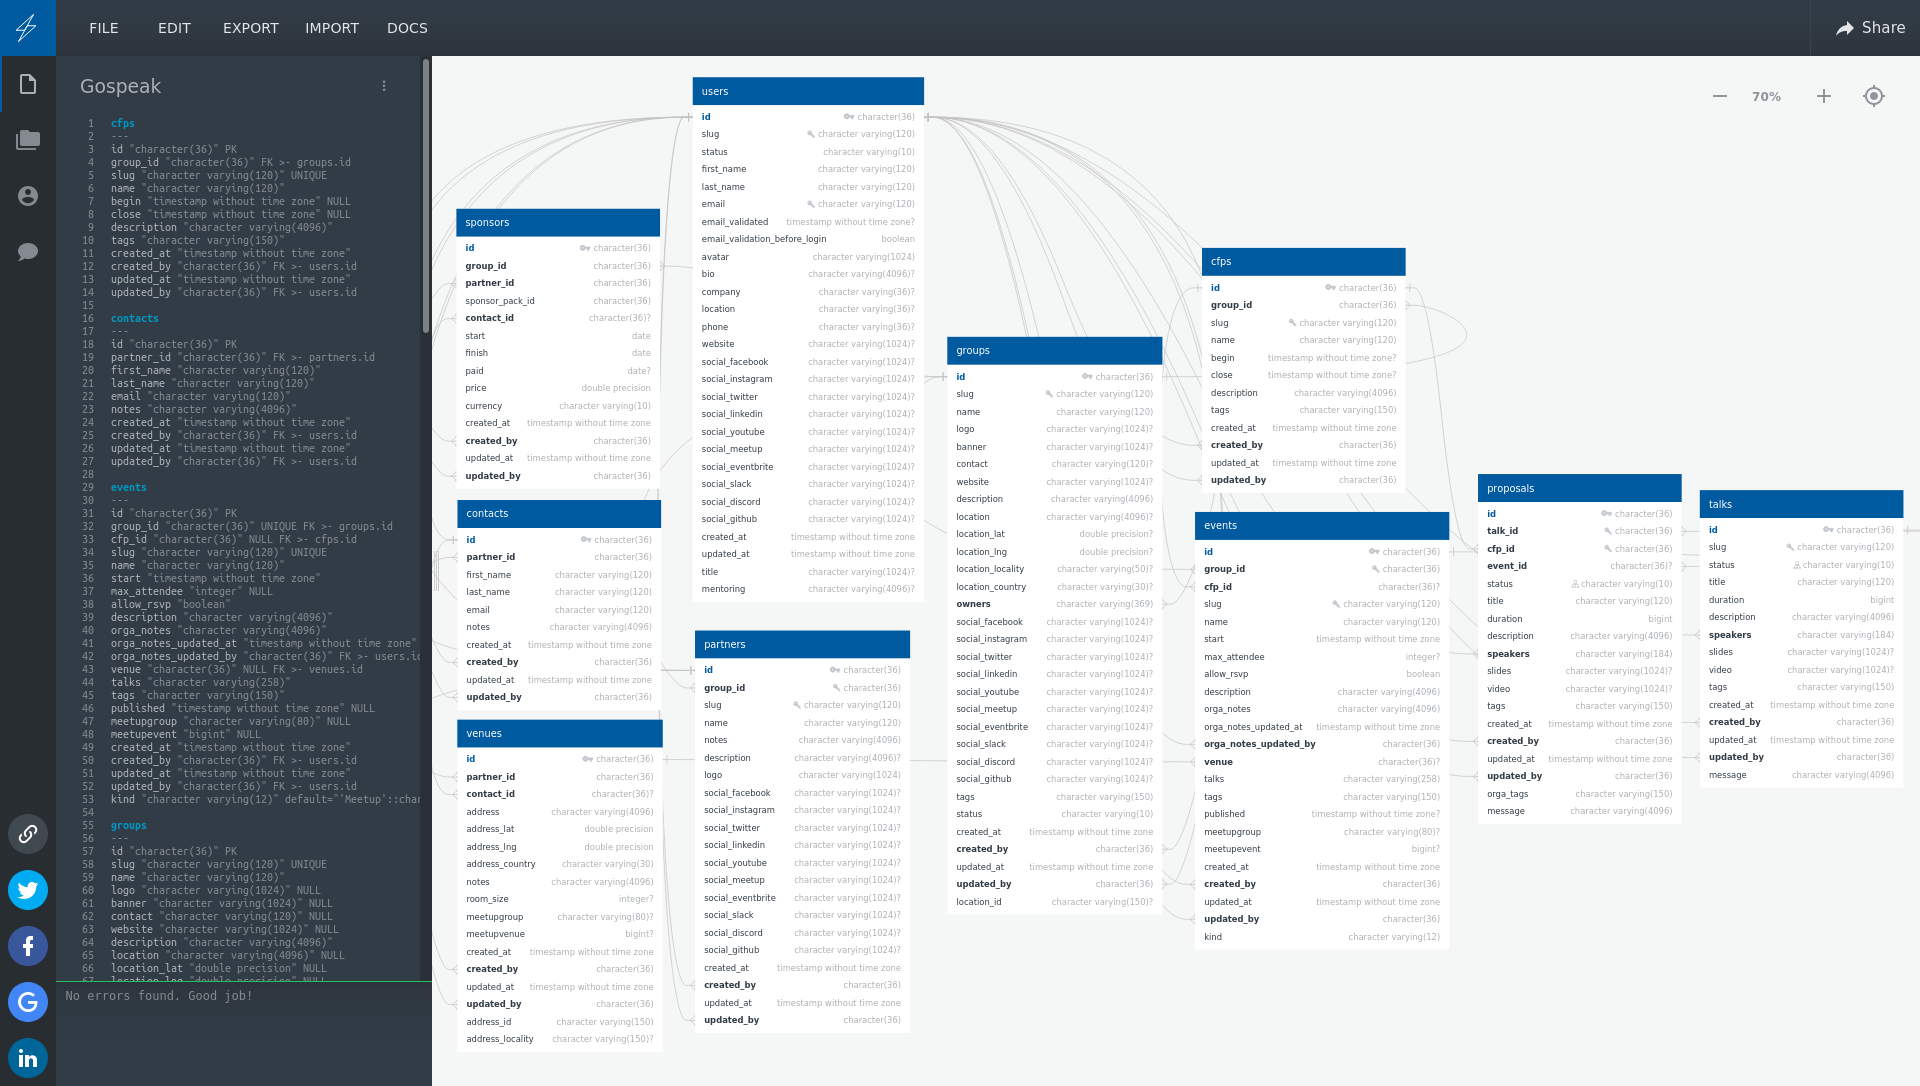
price: free for one public diagram < 10 tables, 14$/month otherwise
Very similar to dbdiagram.io, QuickDBD allows to write your thoughts as code which is very nice. A few difference though… On the positive part, the language is simpler and it has explort to png/svg. But it also has some serious drawbacks: free tier is more limited (only 10 tables), canvas browsing is less advanced (miss relation highlights), no embed mode. Check Gospeak diagram to make your own mind.
Another trouble I had: the import was not working for PostgreSQL scripts. Luckily, Azimutt schema is accessible in the browser console as JSON, so I could use it to generate the needed code 🥳
const allowedTables = ['groups', 'events', 'cfps', 'proposals', 'talks', 'users', 'partners', 'venues', 'sponsors', 'contacts']
const tableAllowed = obj => allowedTables.indexOf(obj.table) !== -1
const cleanRef = ref => ({...ref, table: ref.table.split('.')[1]})
const tables = azimutt.project.sources.flatMap(s => s.tables).filter(tableAllowed)
const relations = azimutt.project.sources.flatMap(s => s.relations).map(r => ({...r, src: cleanRef(r.src), ref: cleanRef(r.ref)})).filter(r => tableAllowed(r.src) && tableAllowed(r.ref))
const quickDbdCode = tables.map(t => {
    const columns = t.columns.map(c => {
      const nullable = c.nullable ? ' NULL' : ''
      const pk = t.primaryKey?.columns.indexOf(c.name) !== -1 ? ' PK' : ''
      const unique = !pk && t.uniques?.flatMap(u => u.columns).indexOf(c.name) > -1 ? ' UNIQUE' : ''
      const index = !pk && !unique && t.indexes?.flatMap(u => u.columns).indexOf(c.name) > -1 ? ' INDEX' : ''
      const defaultValue = c.default ? ` default="${c.default}"` : ''
      const relation = relations.find(r => r.src.table === t.table && r.src.column === c.name)
      const fk = relation ? ` FK >- ${relation.ref.table}.${relation.ref.column}` : ''
      const comment = c.comment ? ` # ${c.comment.text}` : ''
      return `${c.name} "${c.type}"${nullable}${pk}${unique}${index}${defaultValue}${fk}${comment}`
    }).join('\n')
    return `${t.table}${t.comment ? ` # ${t.comment.text}` : ''}\n---\n${columns}`
}).join('\n\n') + '\n'
copy(quickDbdCode)
My recommendation: It’s a very good tool but sadly for it, dbdiagram.io is very similar and seems a bit better in my opinion. But try it, maybe you will prefer this one ;)
Database exploration tools
Similar to database creation tools, the exploration ones display a database schema in an ER inspired diagram. But focus on browsing instead of diagram creation. Which means database schema import is key as well as navigating and interactivity. They target existing databases with many tables and relations (from 10-20 to 500 or even more) instead of green field creations.
Azimutt
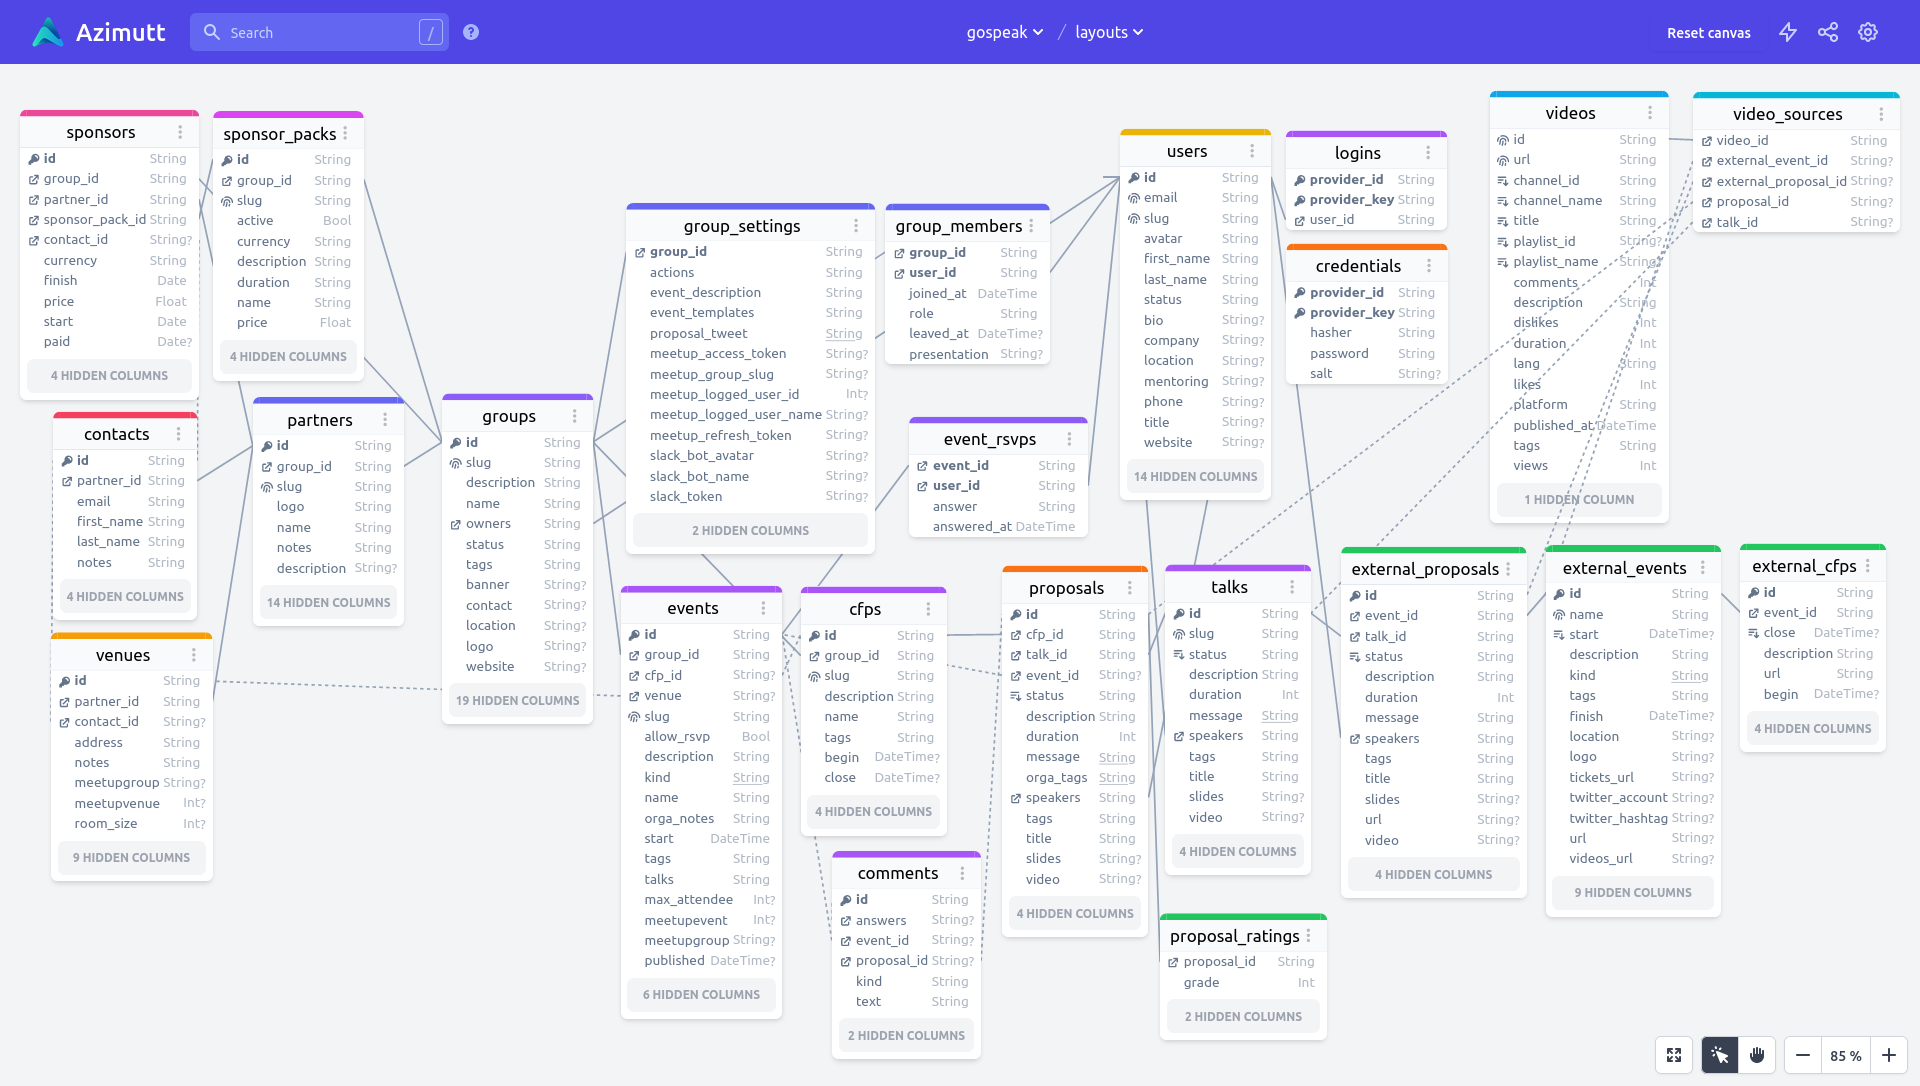
price: free, no limitation
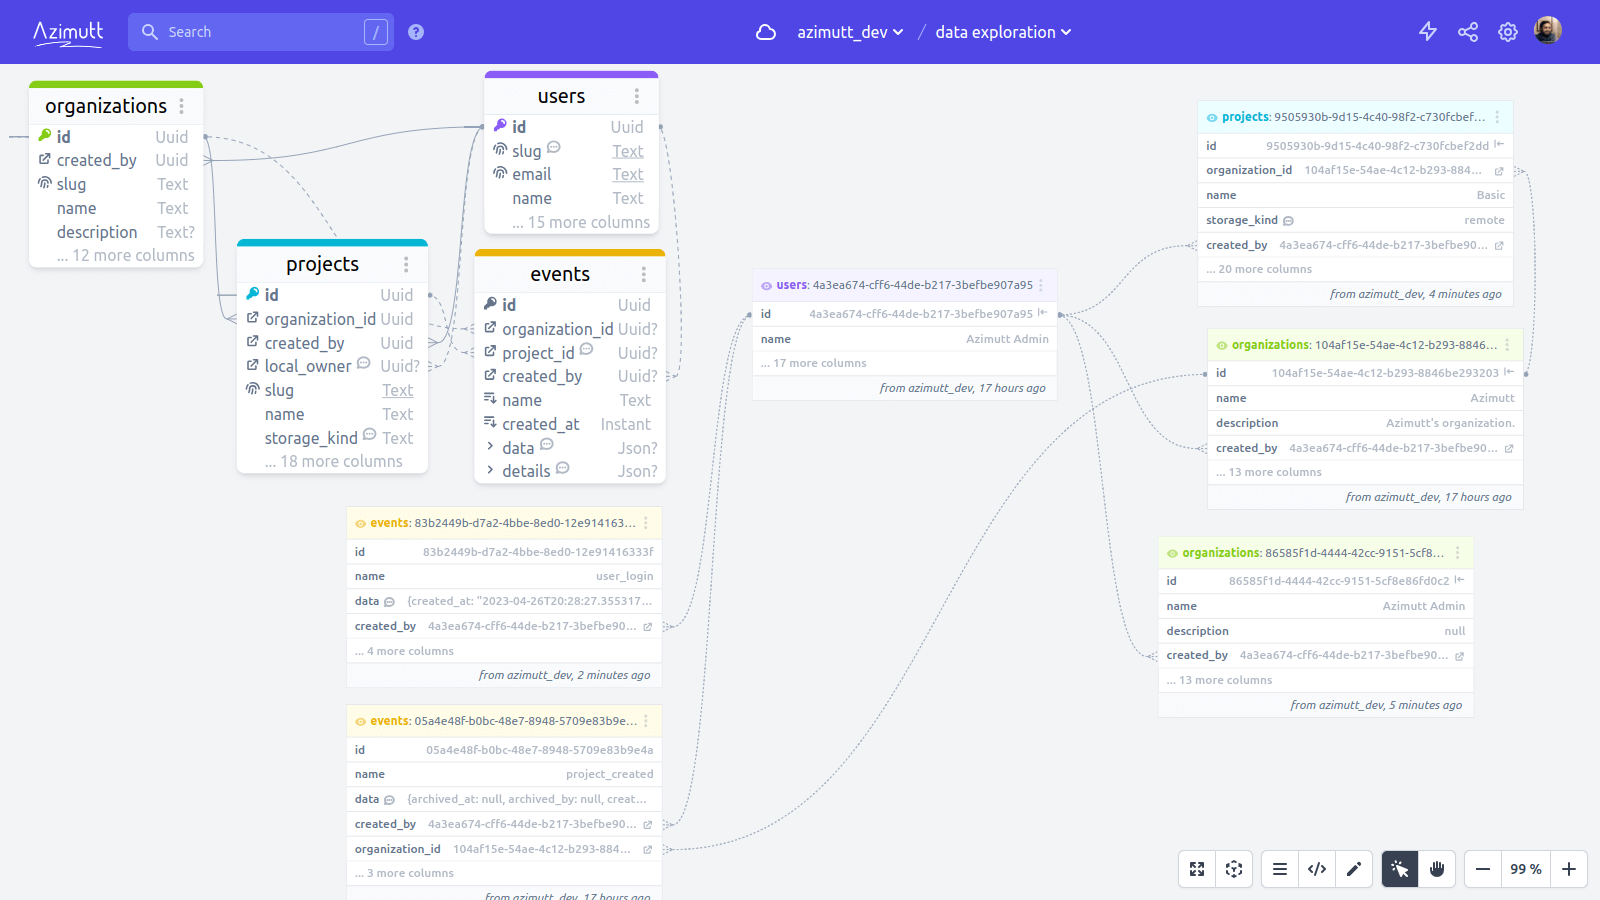
Azimutt focus is to allow you to explore your database schema in the best possible ways and help keep it sane and consistent. It’s almost a read-only tool, parsing precisely your database schema and starting with an empty canvas, a search and few suggestions:

Good points:
- beautiful
- make clear diagrams showing only what’s useful
- save several layouts for specific use cases
- exploration made easy: search, follow relations, find path
- analyze your schema and give improvement suggestions
Missing ones:
- no easy edit mode
- no auto-layout
- no collaborative mode
- not collected to a live database
You can embed Azimutt diagrams to easily share them with anyone you want:
My recommendation: If you have a database you are trying to explore/understand, Azimutt is clearly the go-to tool, it can even detect and suggest some improvements. If you want to quickly draft your database ideas, prefer tools like dbdiagram.io, DrawSQL or Excalidraw which are more flexible.
Final words
If you want to evaluate readability of each tool, look at each screenshot, it’s the same schema, from Gospeak, I used, sometimes with some limitations due to free/trial plan, but you should see similar things.
I only know Azimutt in the last category, and it’s basically the reason I built it as I could not find any tool like it. If you know some, please let me know, so I could include them here. The same if you know good tools to design and understand a database schema, I will review them and include them if I think they deserve it.
Creating and managing a database is always a hard task, no matter how you approach it. Having tools can help but in the end, everything comes back to your understanding of your system and how it works, either from your business process and internally. Be strong!
Other blog posts
You might be interested in these other articles