Are you ready to be amazed?
Why data exploration
Azimutt started two years ago as a database schema explorer, just because there were no decent tool made for a large database (700+ tables). But since then we made a long way, and this part is now quite good, and unique, for exploring your database schema.
Still, developer needs don’t stop there. Sometimes you need to look at the actual data to understand how the database works. We left this part on the side as other tools could be used, and we were already quite busy. But this summer we decided to change that!
We gathered ideas accumulated during these two years, made a large benchmarks of tools like Prisma Studio, Trevor, TablePlus, Metabase, PopSQL, DbInsights, Supabase… and took Azimutt to the next level. 1 month, 55 commits and 10k lines of code later, we have a great proposal to improve your daily life working with a database.
Azimutt data exploration
What we built into Azimutt is not just a data exploration feature added to the product. Of course there is a dedicated pane to query and visualize your data but more importantly, there is a lot of integrations everywhere in the tool allowing you to mix schema and data exploration, being able to access and navigate as easily in your data than in your schema.
We didn’t make the best SQL client. We didn’t make a beautiful analytics tool. We didn’t make the most powerful dashboard system. We made a data exploration tool to help developers understand better and quicker their databases, which is our core mission.
The data explorer pane
 Sometimes data say more than schema
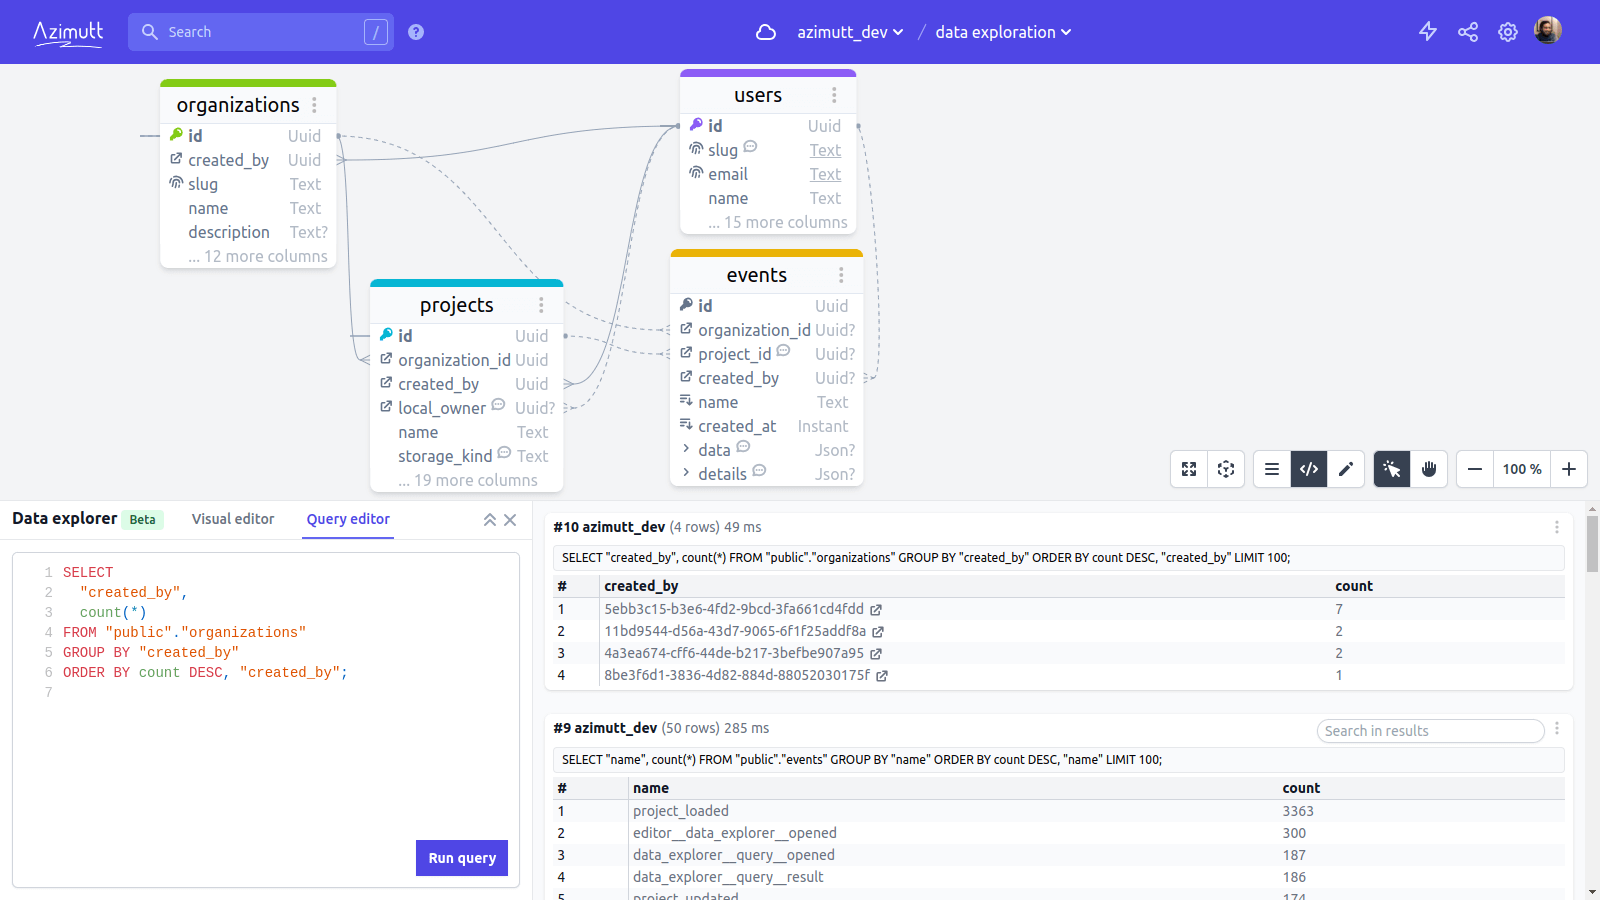
It may be the most obvious part when thinking about Azimutt data exploration, you can open it with the “Explore your data” button on the bottom right and you can query your data, either from raw SQL or with a basic GUI explorer.
On the right, you see your query history with their results, making it super easy to view, compare and save several ones at a glance.
If you need more space, you can make it full-screen:
 Data is heavy, full-screen may be your savior
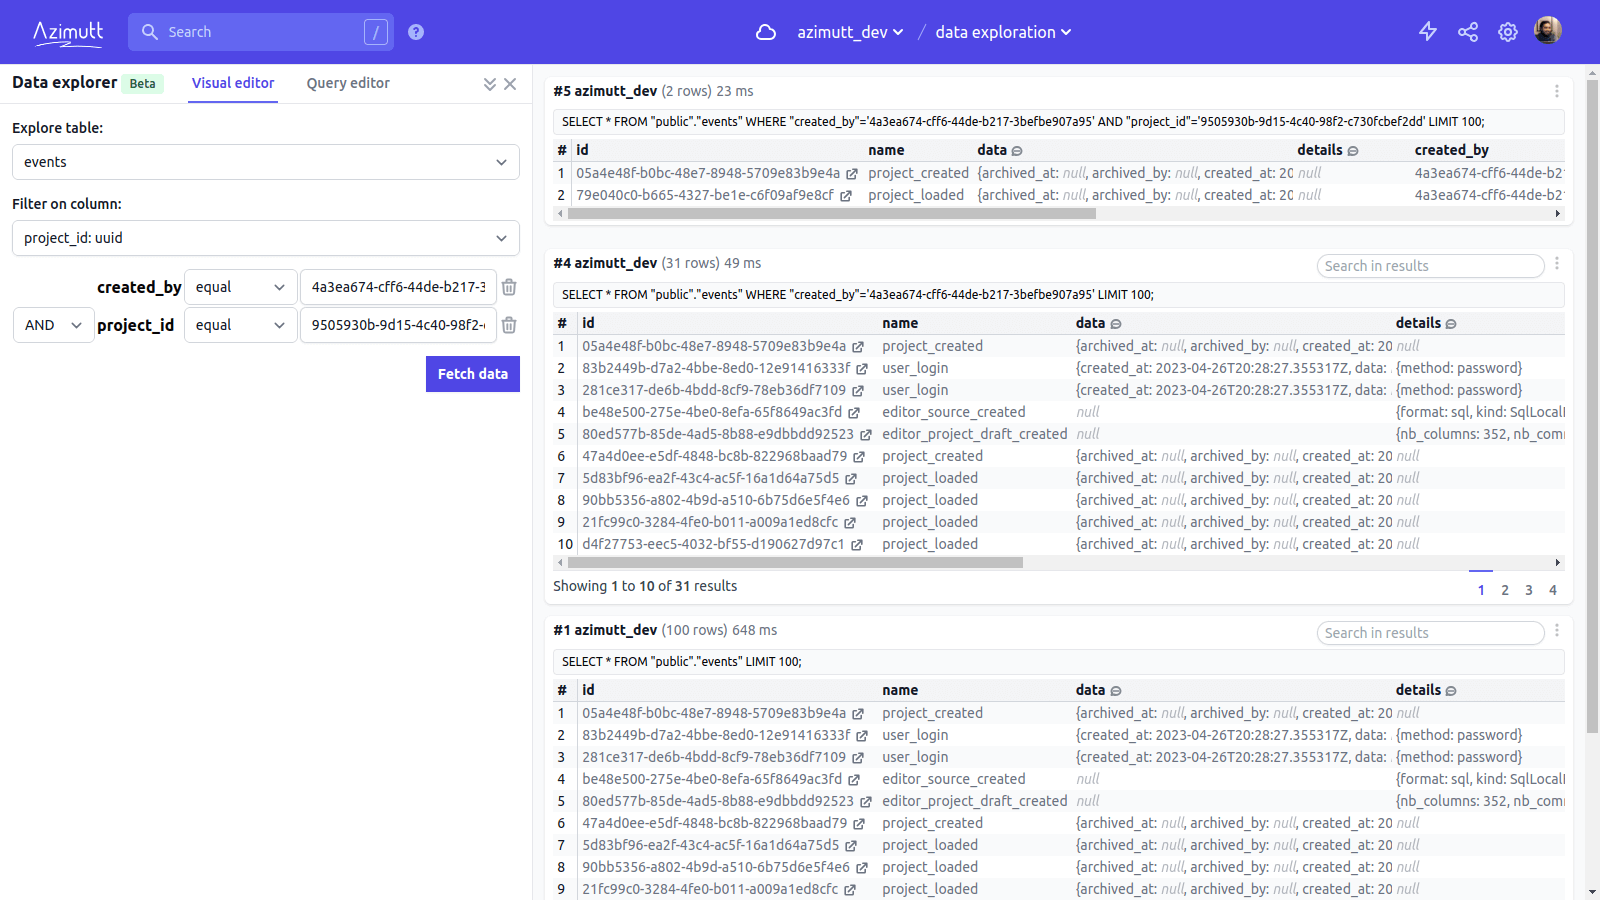
These small result cards may seem simple, but they are feature packed and powerful. You can search, filter and sort your results. See SQL comment and Azimutt notes for each column of the result set, as well as column statistics (min, max, average, uniques…). Expand JSON fields to make them more readable. Export data in JSON or CSV and even replay queries to see data updates.
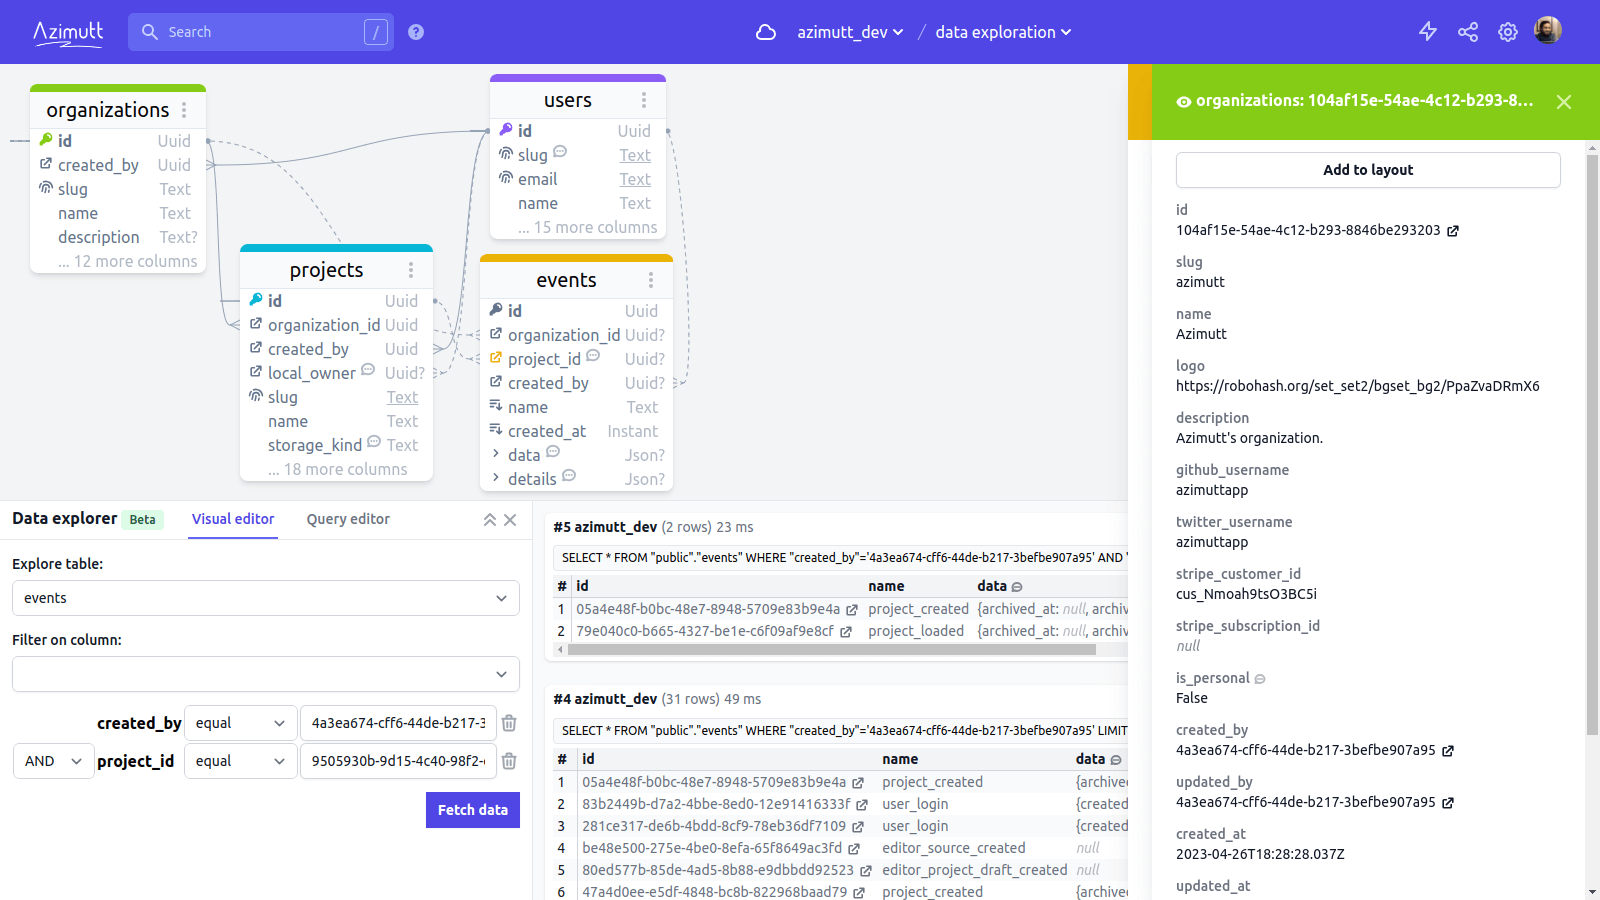
But my favorite feature, I’ve dreamed of since the beginning, is the row sidebar. For any primary key or foreign key, you can open a side panel to see the full row. Very useful to know in one click who is the 70fd3c03-756b-478a-95c2-84faee66504d user, and they are infinitely stackable 😅
 Row panels are stackable to follow relations as deep as you need
All this was my initial plan, but as I worked on it, I found an obvious, but still never seen, way to explore relational data… 🤯
A diagram of table rows
What if, instead of navigating table definitions in an Entity-Relationship Diagram, we could explore dynamically the actual data?
Instead of having a table and its columns, we have a table row with its columns and values. And as tables have many rows, we could see several rows for the same table. Making some hard to understand patterns much more easy, for example table with foreign keys on them to find parent row.
We made it:
 A diagram made with table rows to visualize and navigate them easily
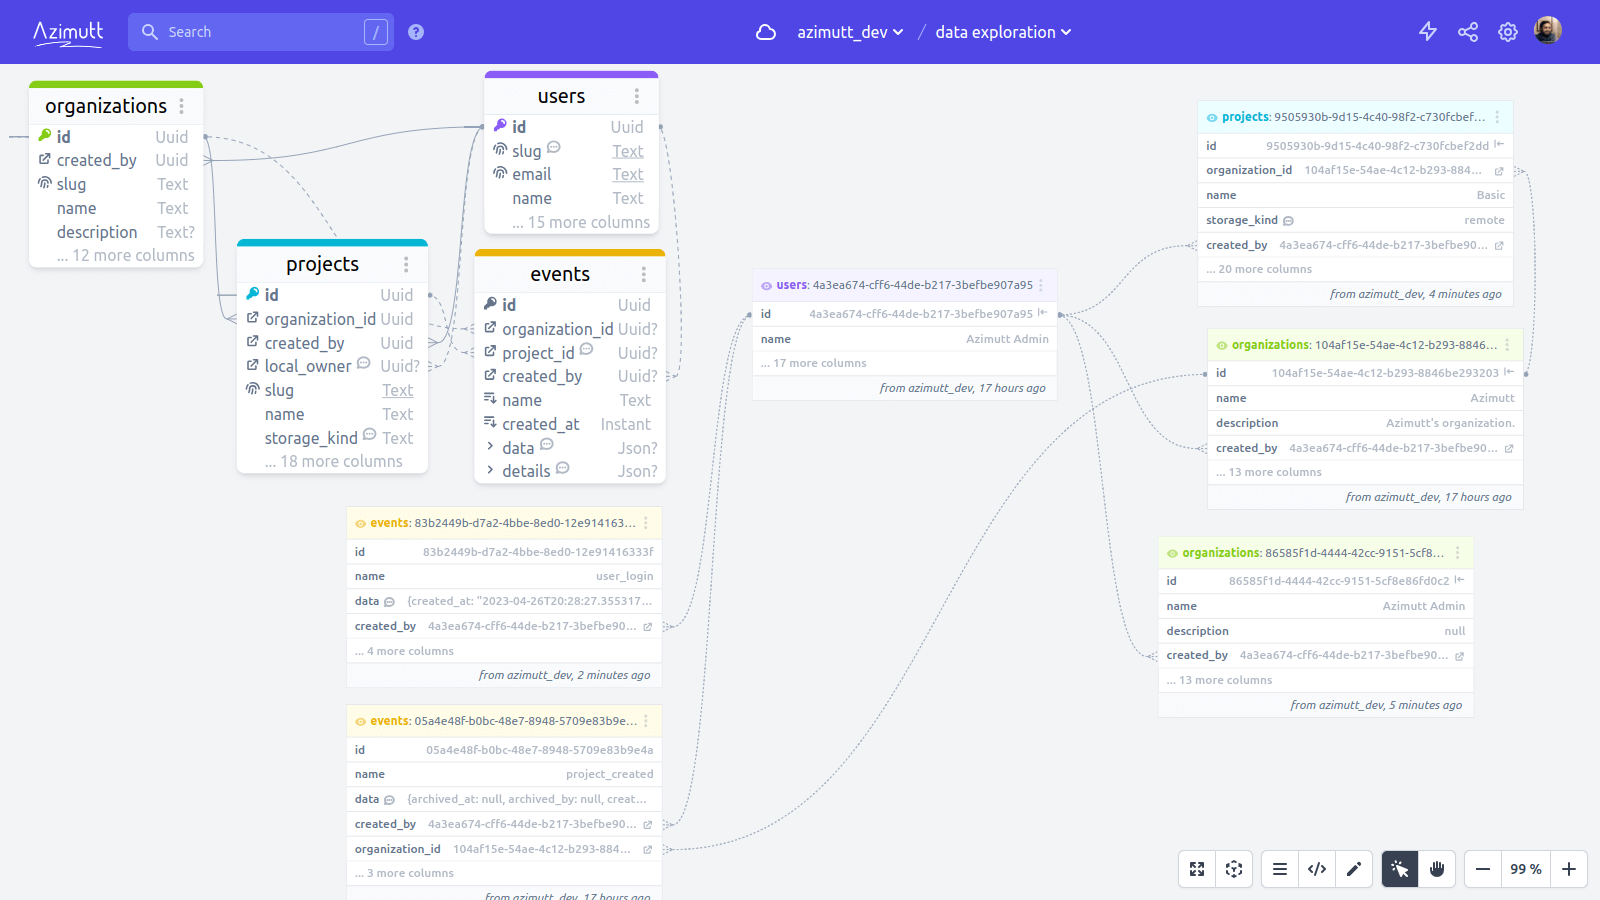
Any row opened in the row sidebar can be added to the layout, and from it, you can follow relations. Row foreign keys, of course, this is easy (yet very useful), but also incoming rows pointing at this specific row:
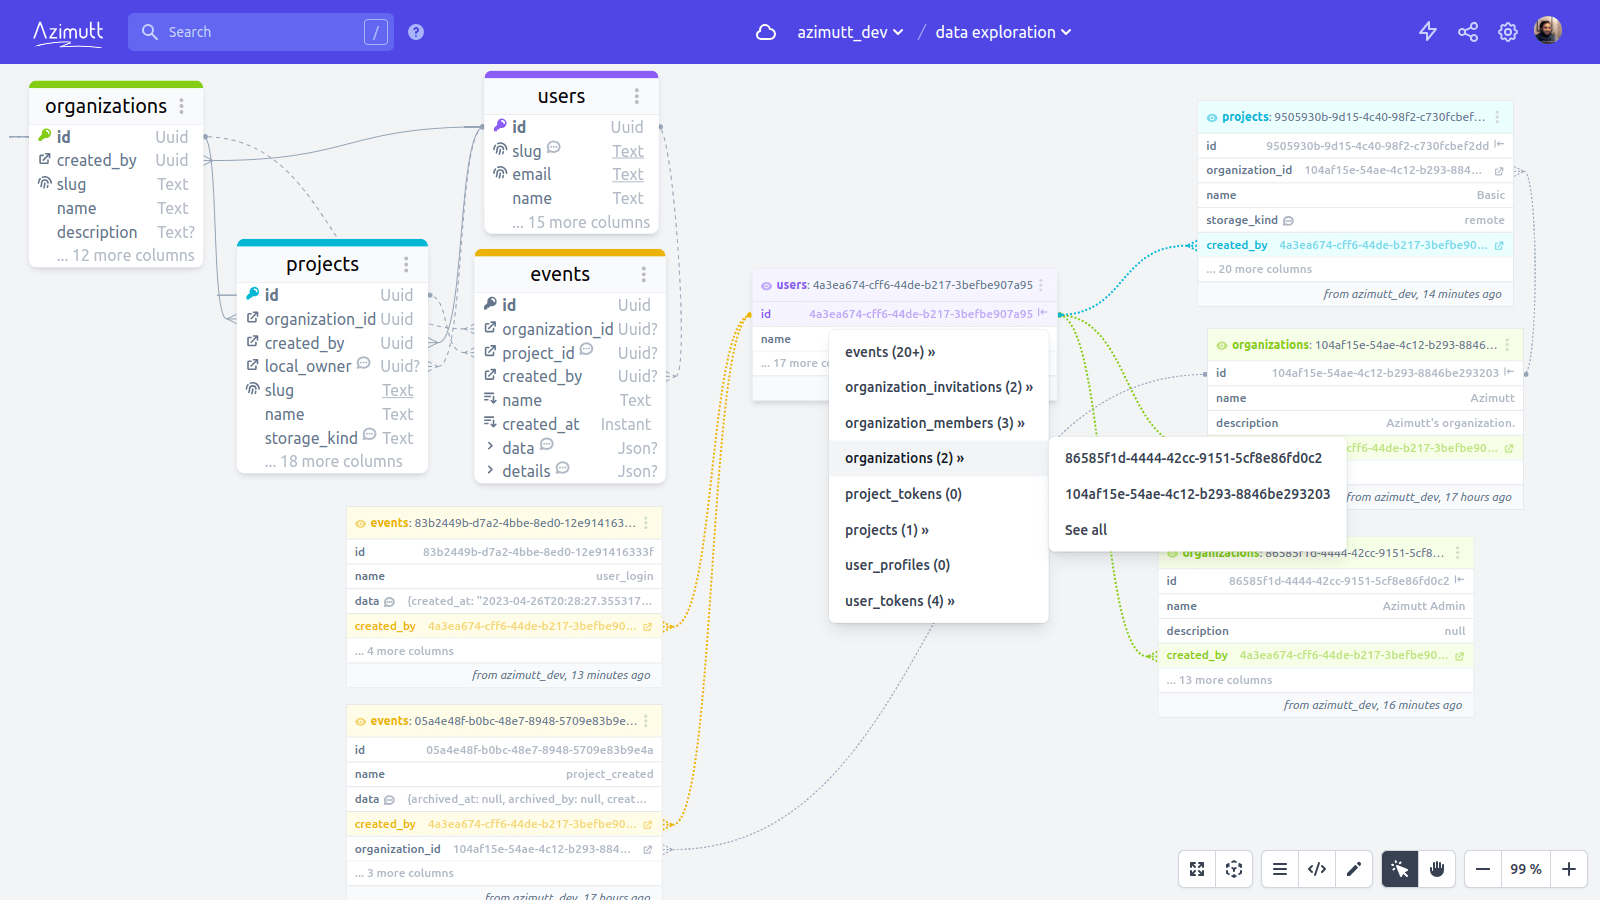 Click on value icon to go to the target row (foreign key) or see incoming ones (primary key)
It can ease investigations to understand how data are linked. It can serve as documentation, for example or specific use cases. I don’t know about you, but I’m very excited and proud about this very unique feature 🤩
If you try it, tell me what to you think. Is it as useful for you than it is for me?
A two-way integration
As I said in introduction, Azimutt data exploration is not just one or a few features added to the product. It’s a close integration between schema and data exploration to easily move from one to the other and make the best experience for exploring and understanding any database.
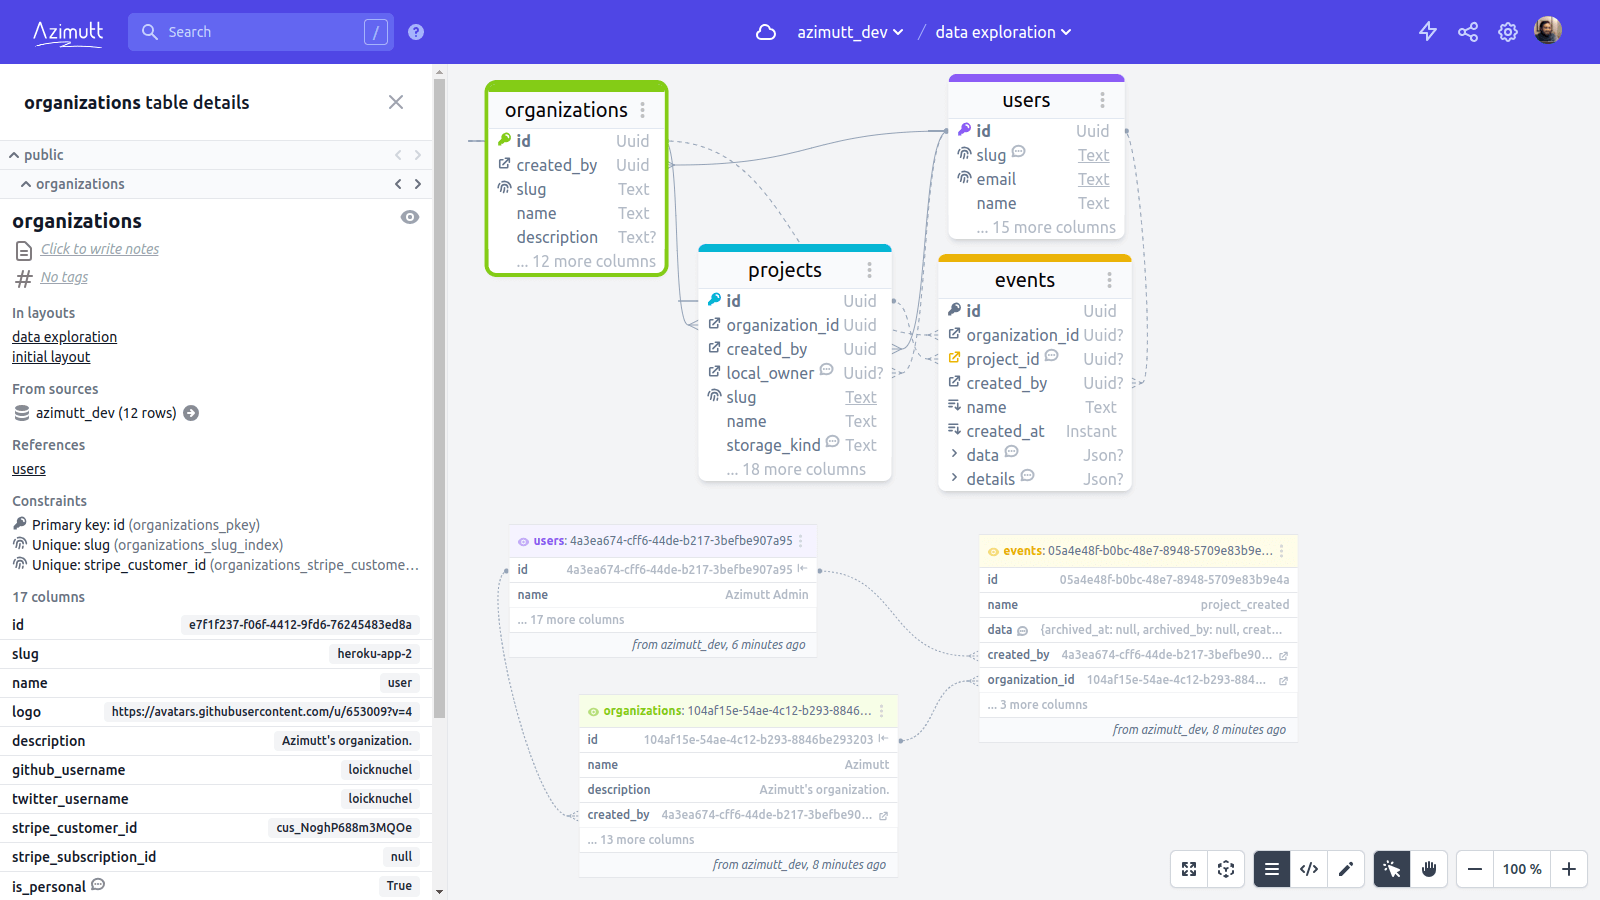
From any table row or row sidebar, you see SQL comment and Azimutt notes, but you can also go back to the table definition with the small eye next to the table name.
From any table or column, you can right-click and use the “Explore data” option to see them very easily. It will open the data explorer pane with a query showing relevant data. This is also accessible in the table and column details sidebar under the sources section.
And there’s more, in table details sidebar you will see the table row count and some random non-empty values for each column:
In the column details sidebar you will see some column statistics and the most used values:
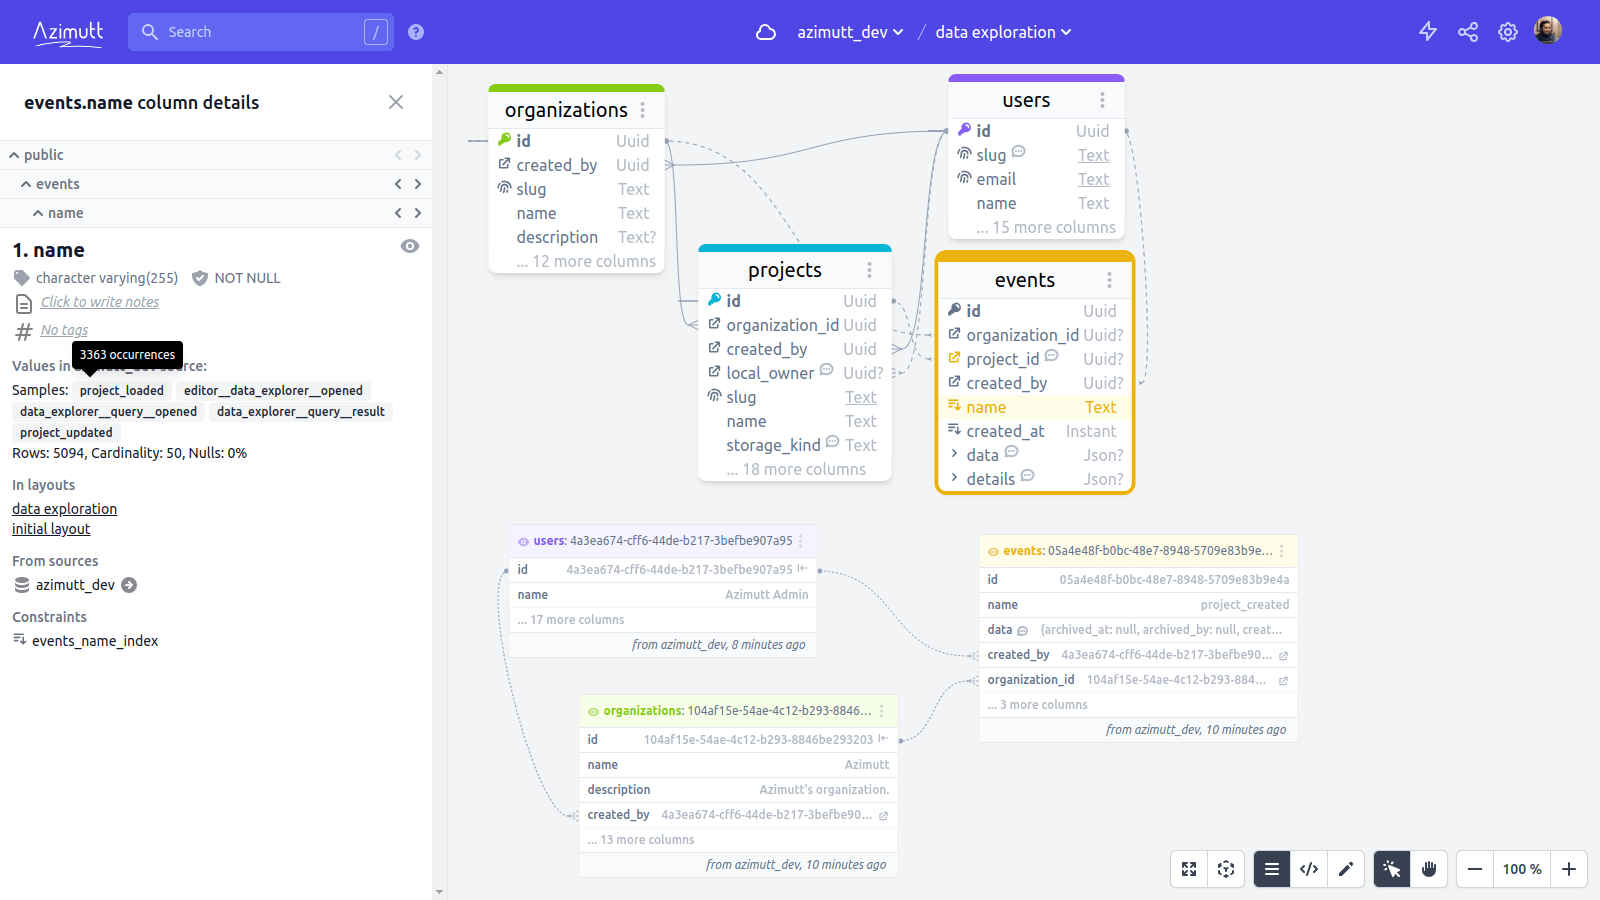
We believe that being able to navigate the schema and the data at the same time is a game changer for developer productivity, avoiding long research and white board drawings 🥳
It’s not finished!
I presented you the most useful features in Azimutt to explore your data and I believe this is already a huge improvement from the available tools on the market, at least for the ones I could find. Yet, we still have a few more ideas which could be game changer. But first, we want to hear from you. What do you think about Azimutt data exploration? How is it compared to your current tools? Do you have any improvement suggestion to make? If you have any question or want to know more about what’s next, let’s discuss on Slack, Twitter, LinkedIn or Email 😉
If you haven’t started yet with Azimutt, have a look to our inspiration gallery or even better, connect your database to experience this first hand, no sign up or credit card required.
Other blog posts
You might be interested in these other articles